Data Science Overview 📖
MATH/COSC 3570 Introduction to Data Science
A Little History of Data Science
- In 1985, Dr. Jeff Wu used the term Data Science for the first time as an alternative name for Statistics.
- In 1997, Dr. Wu calls for statistics to be renamed data science and statisticians to be renamed data scientists.
- In 2001, Dr. William S. Cleveland advocated an expansion of statistics beyond theory into six technical areas, and the altered expanded field will be called data science.
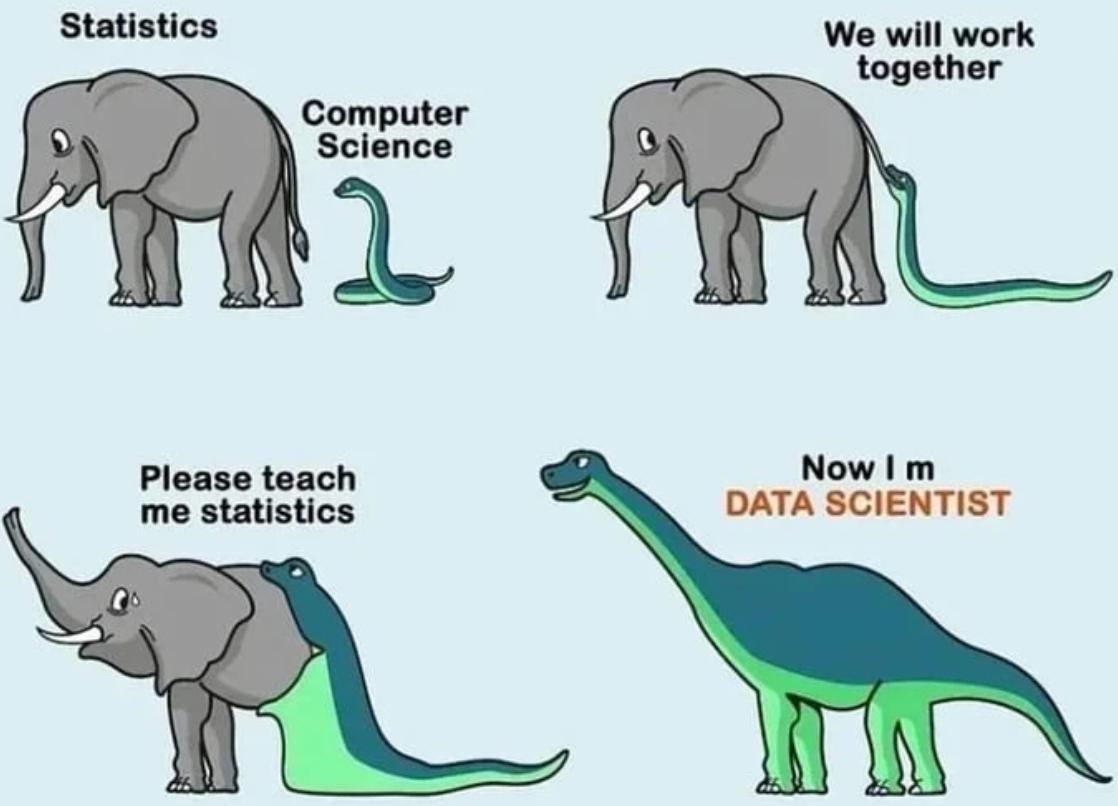
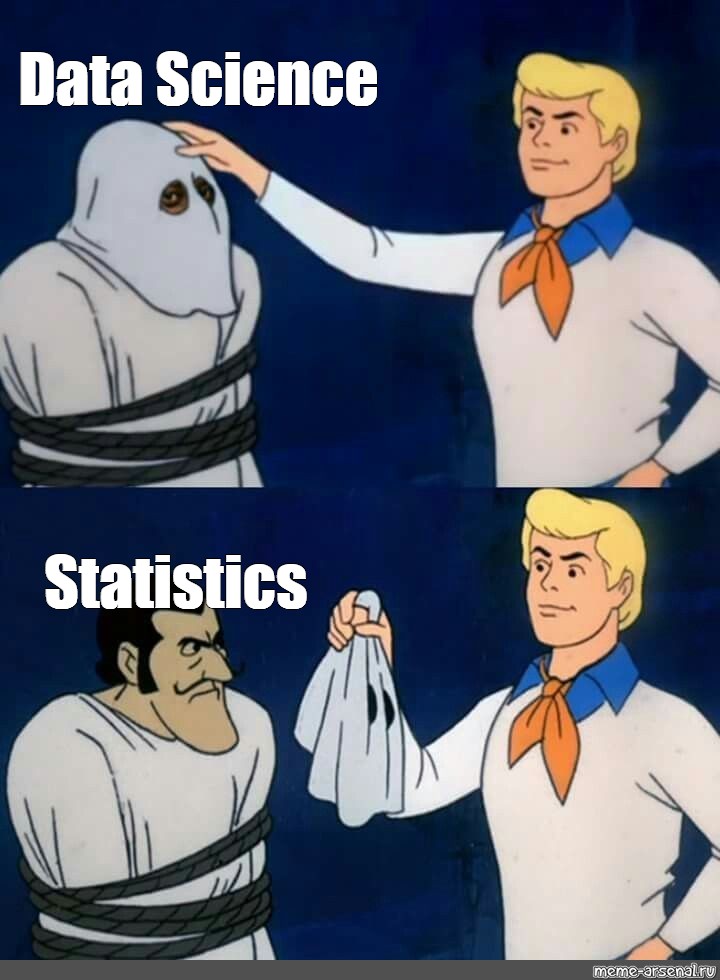
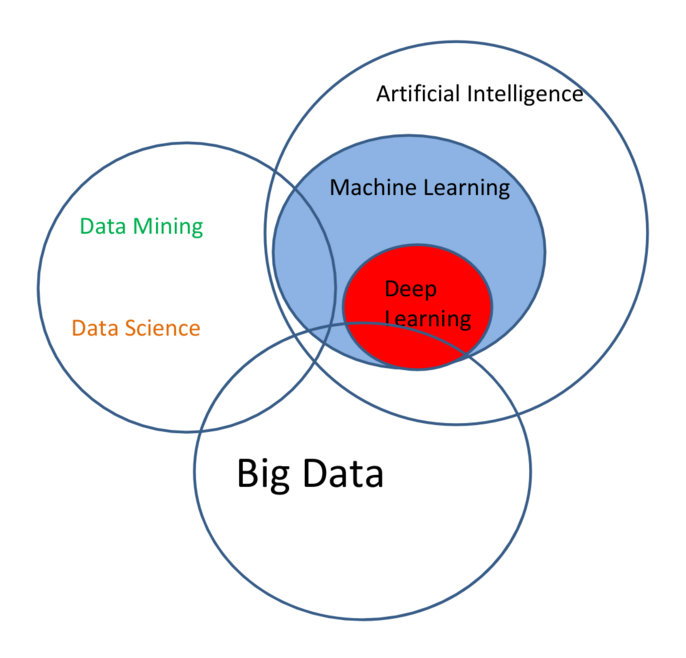
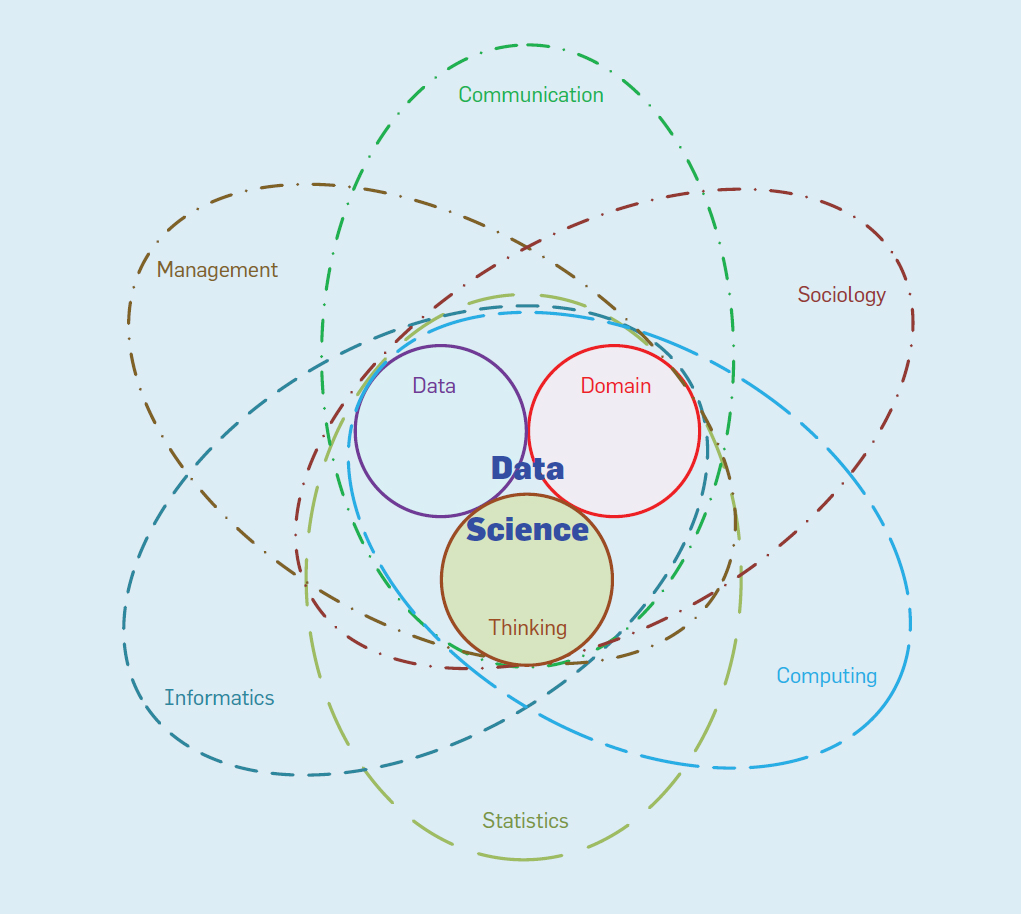
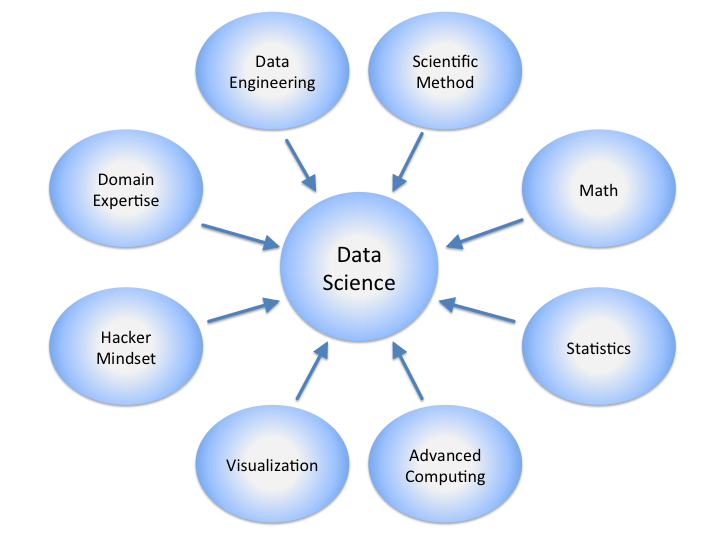
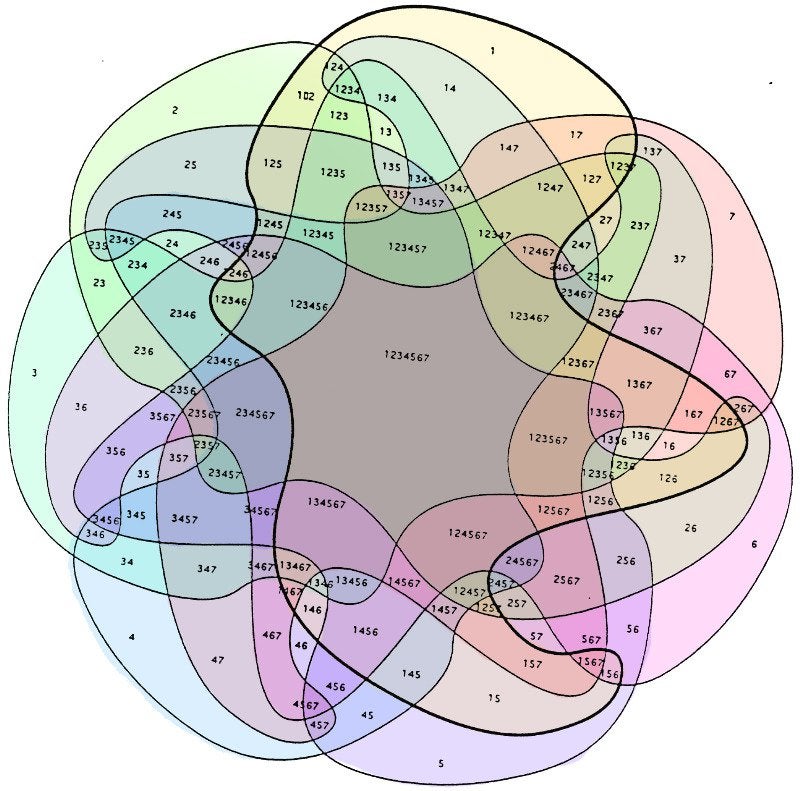
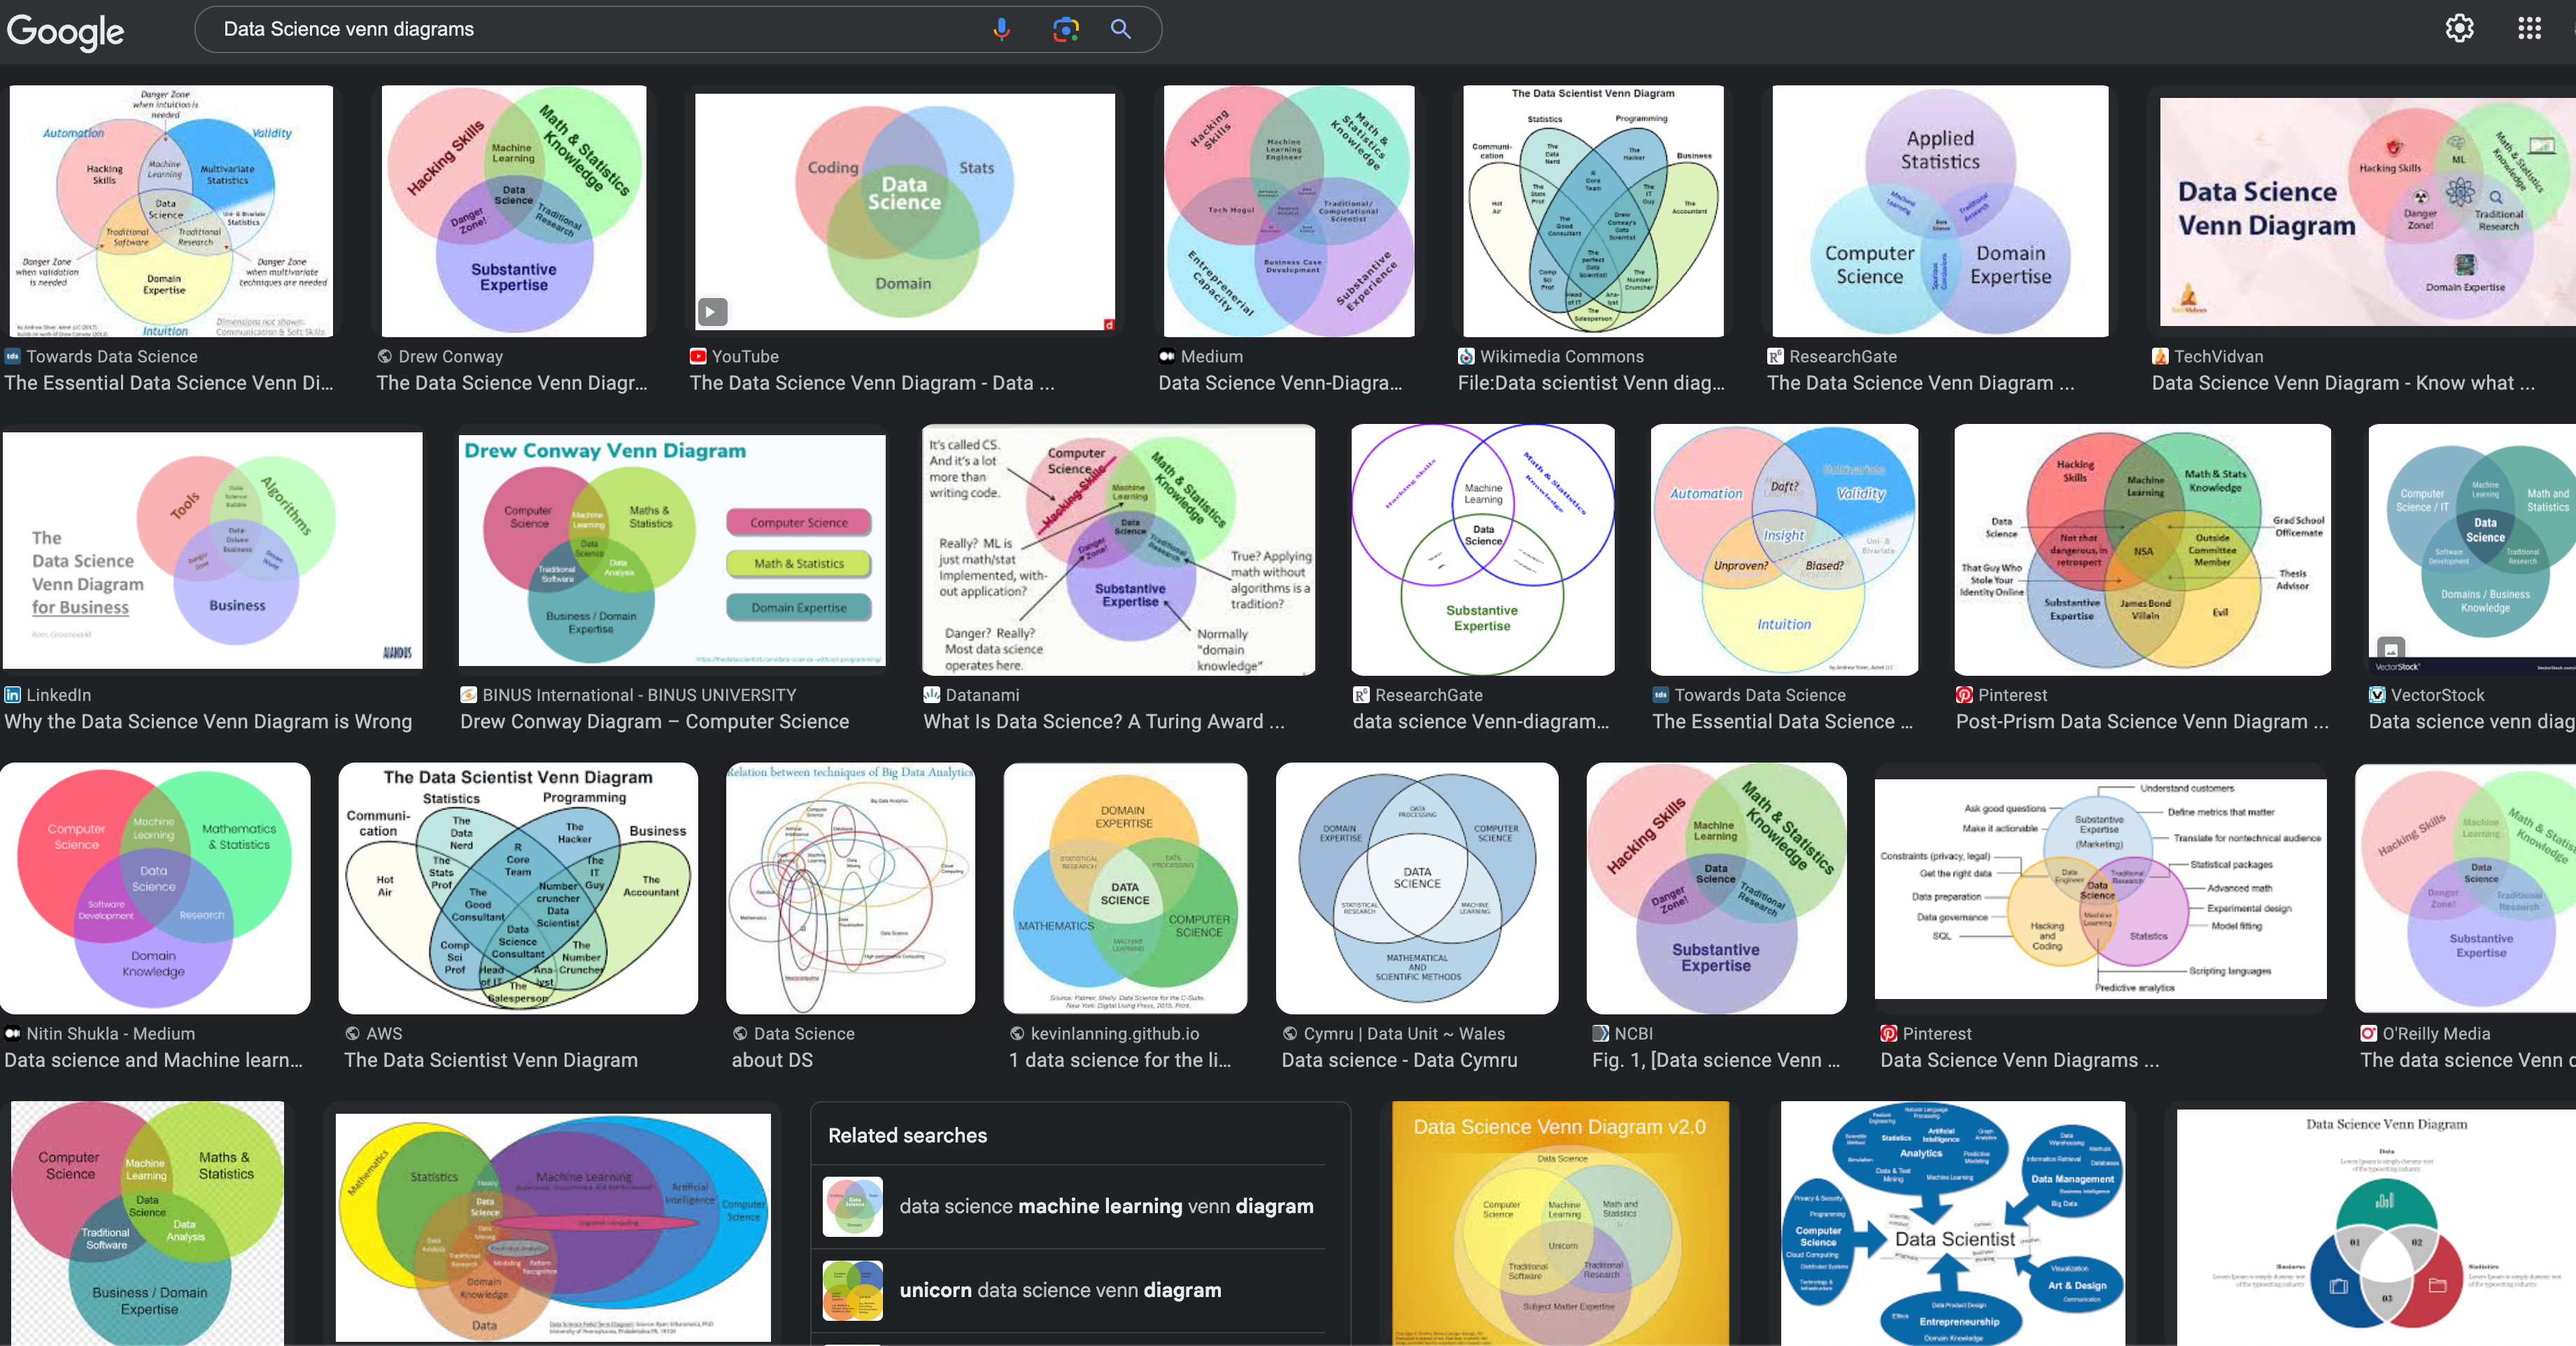
Battle of the Data Science Venn Diagrams
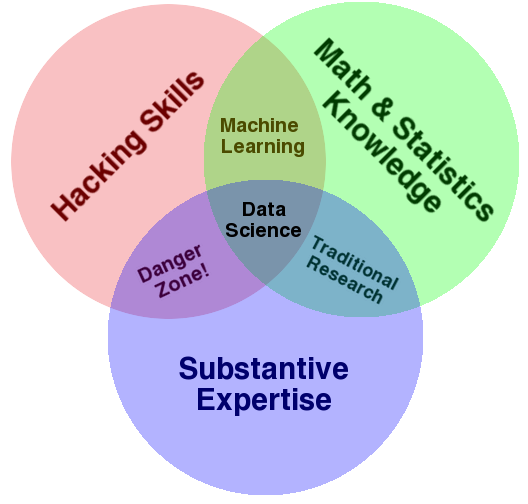
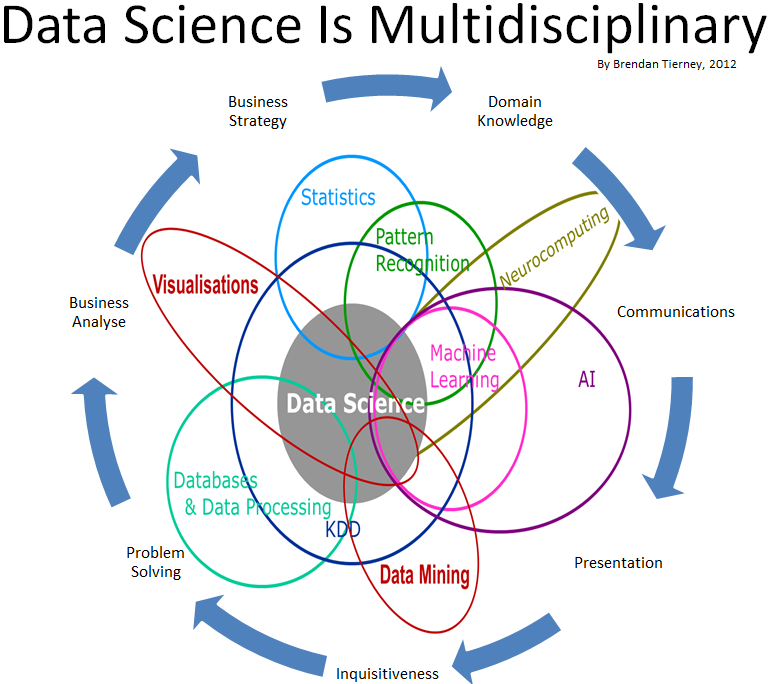
Battle of the Data Science Venn Diagrams
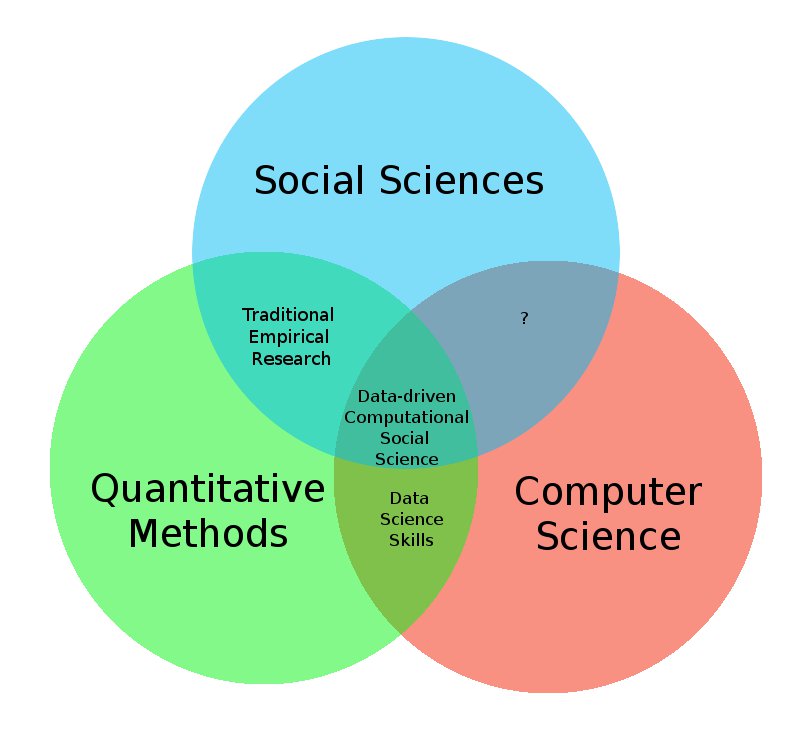
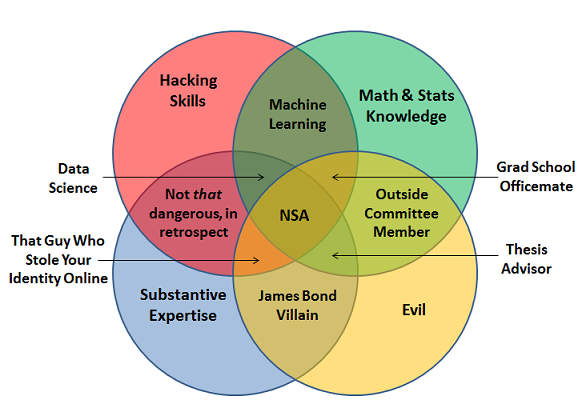
Battle of the Data Science Venn Diagrams
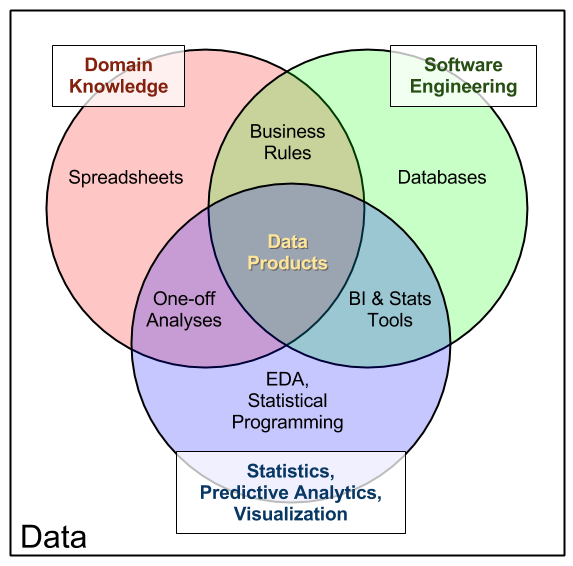
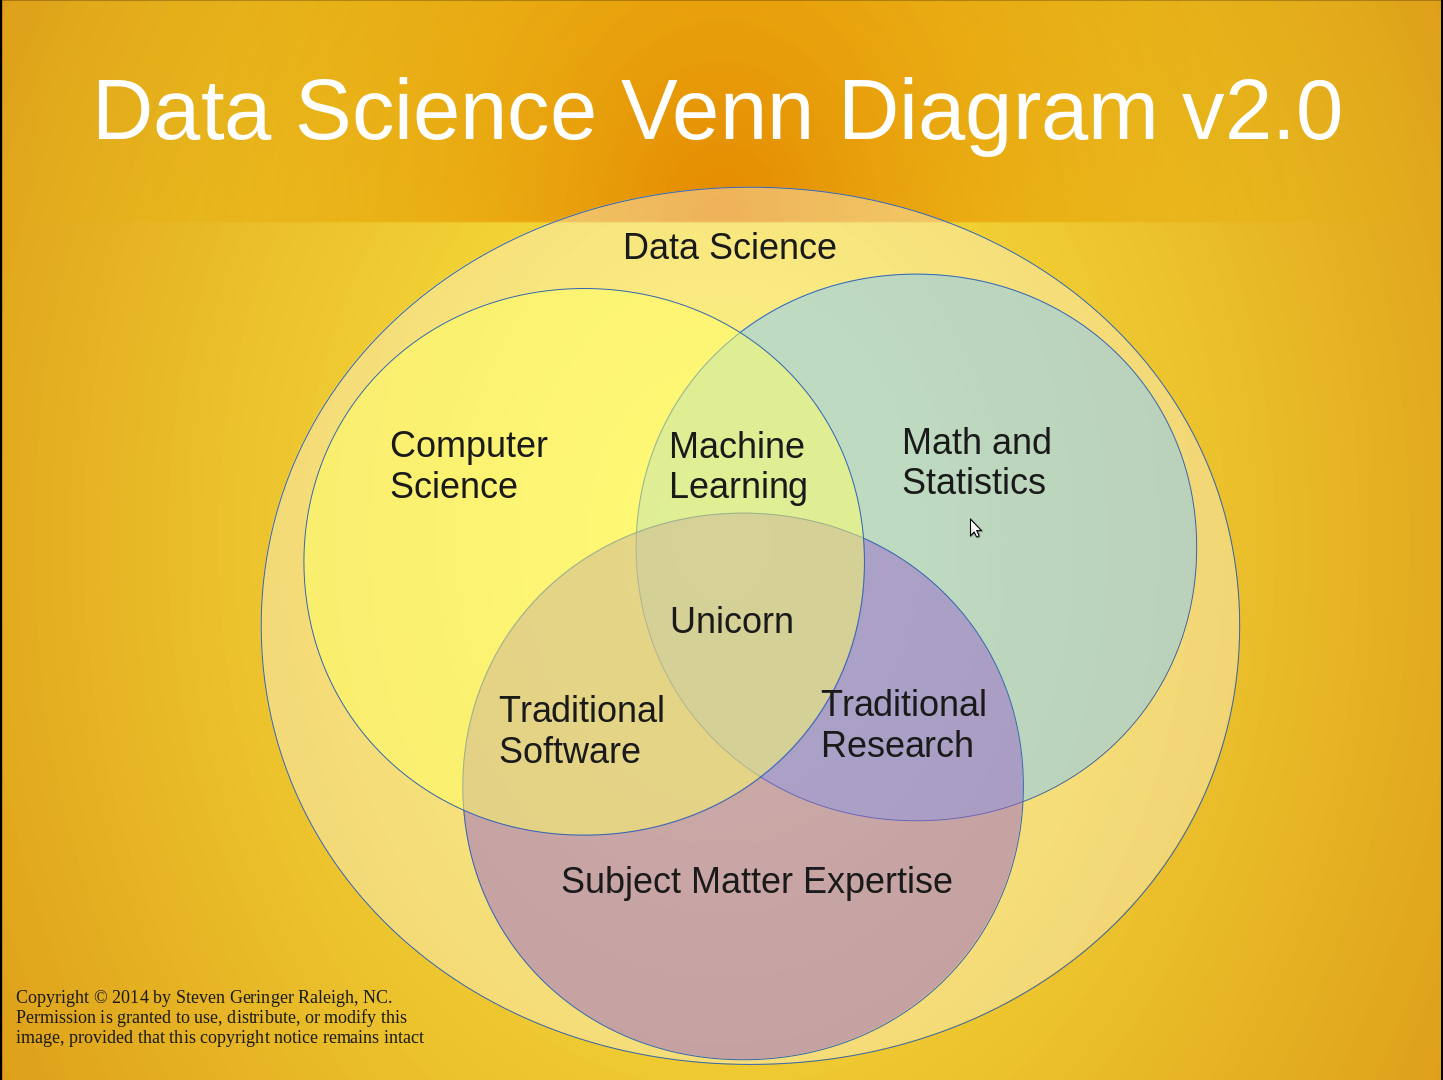
Battle of the Data Science Venn Diagrams
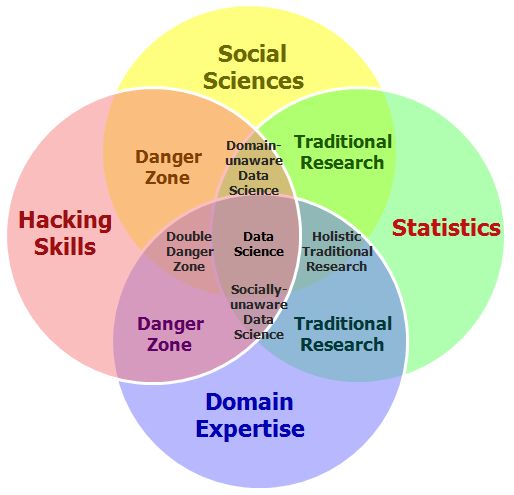
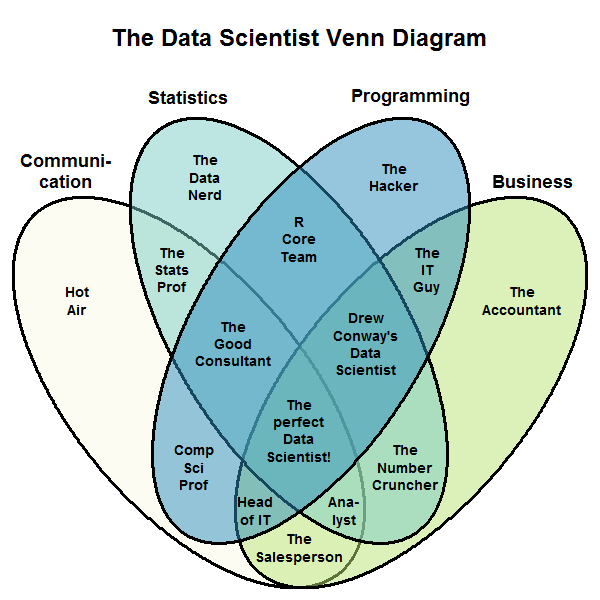
Battle of the Data Science Venn Diagrams
Shall We Continue?
- You probably get the idea. There are so many ways to define data science.
Nobody Knows What Data Science (Scientist) is


- 💰 💰 Dr. Grant (Statistics Education Research Journal, 2017): Data science is the field of people who decide to print “Data Scientist” on their business cards to get a salary bump! 💵 💵
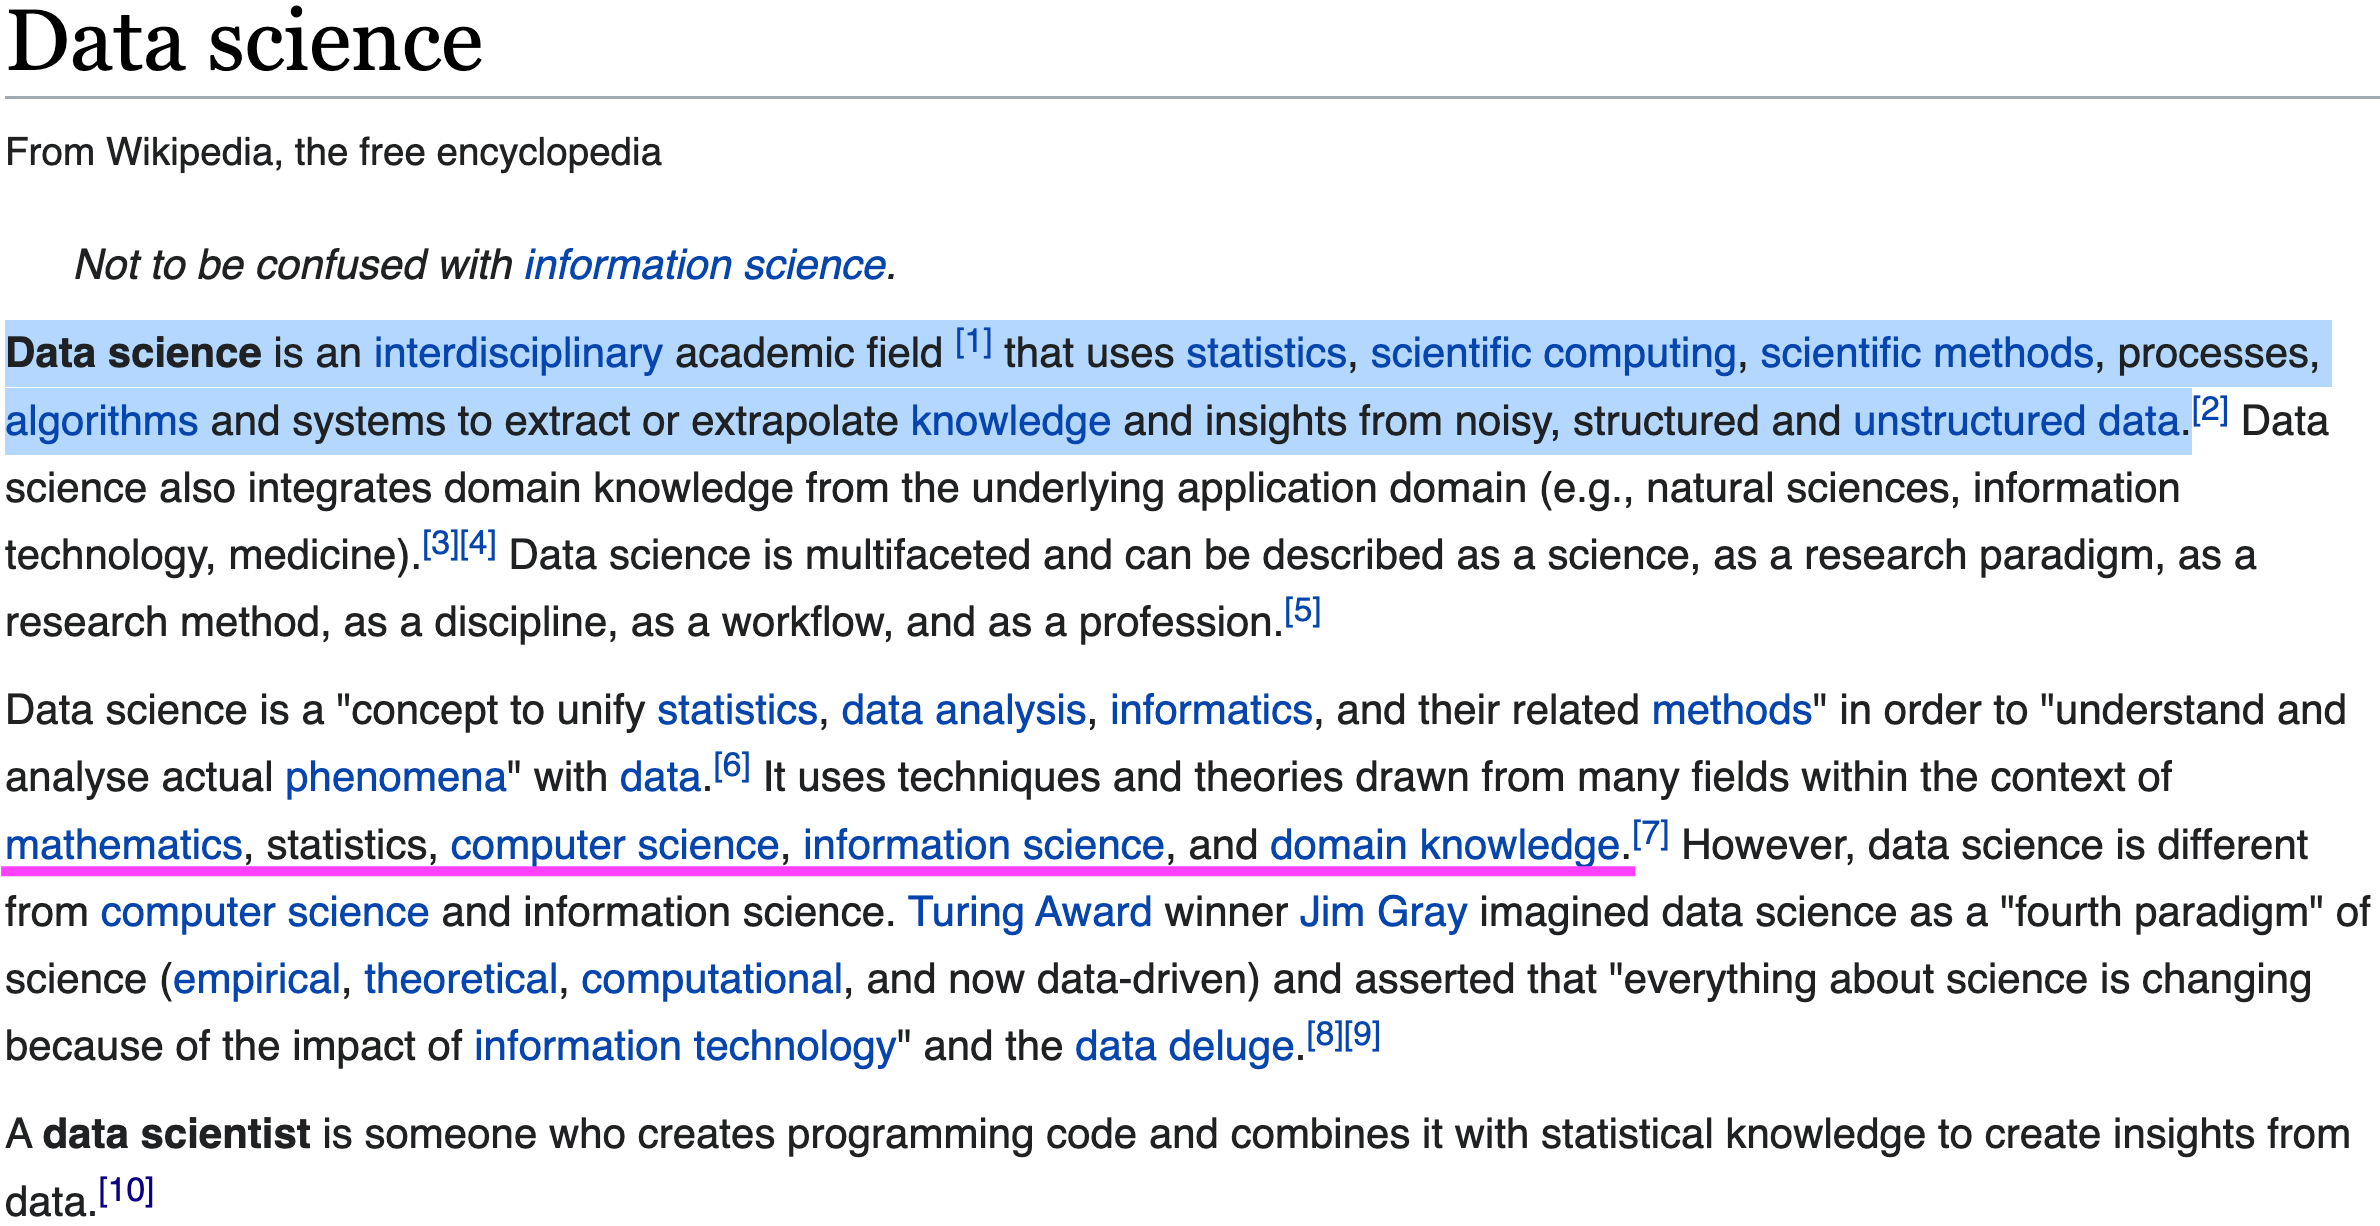
What Wiki Defines
Data Science Workflow
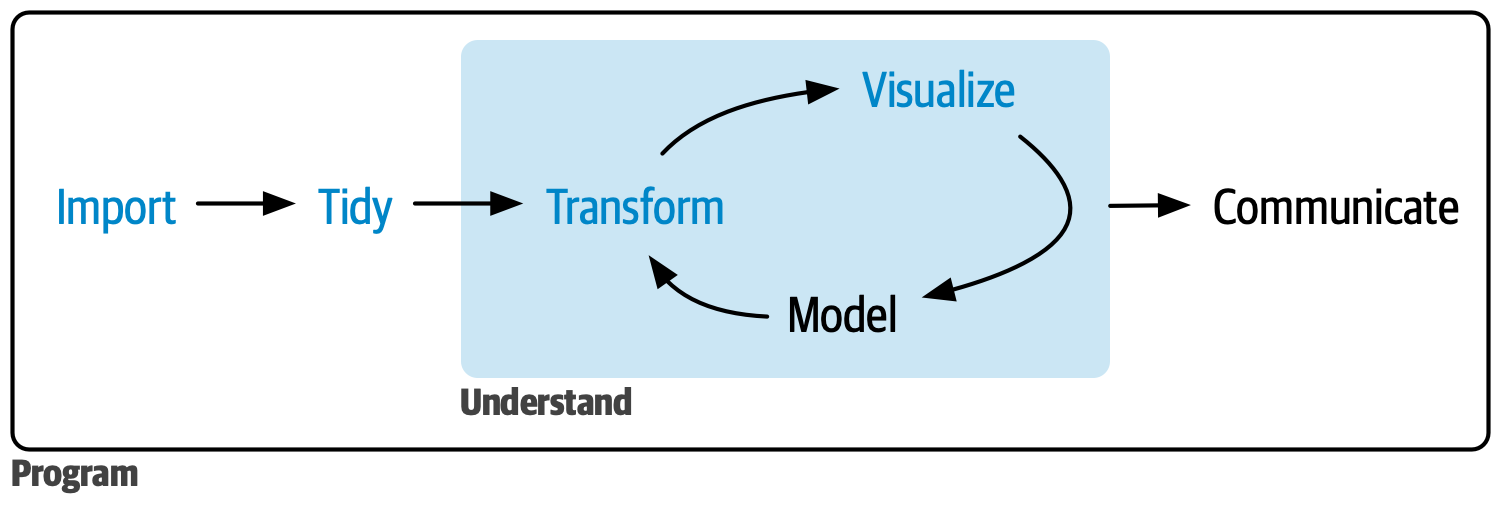
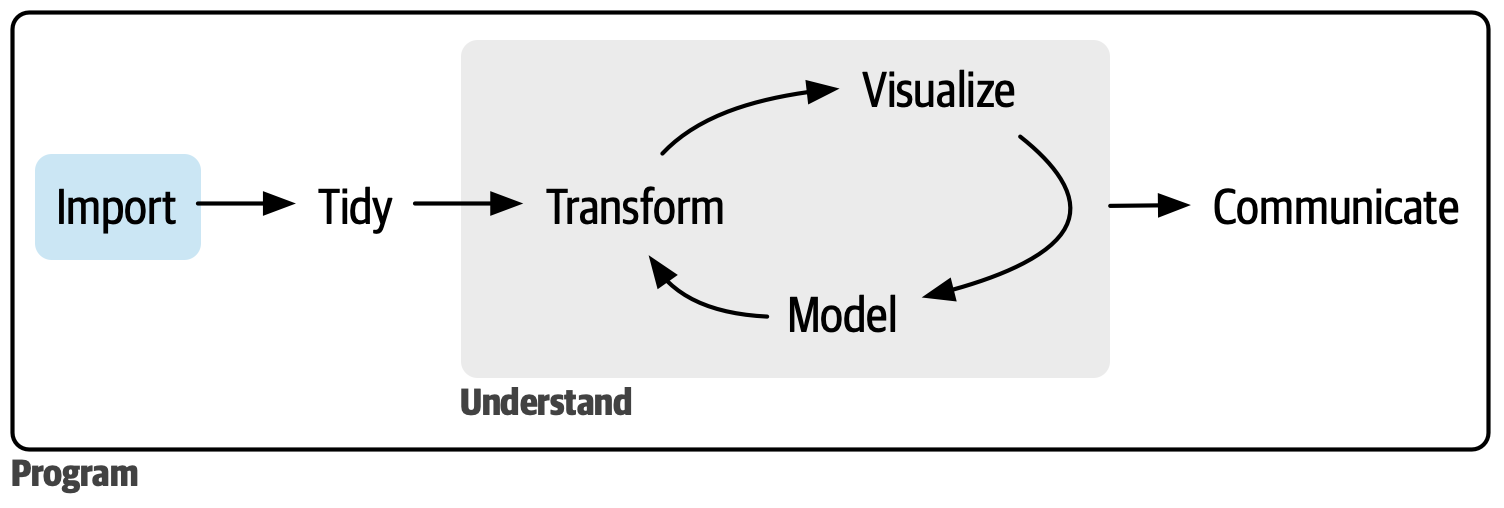
- Import: Take data stored somewhere and load it into your workspace.
- Tidy: Storing data in a consistent rectangular form, i.e., a data matrix.
- Transform: Narrowing in on observations of interest, creating new variables, calculating statistics.
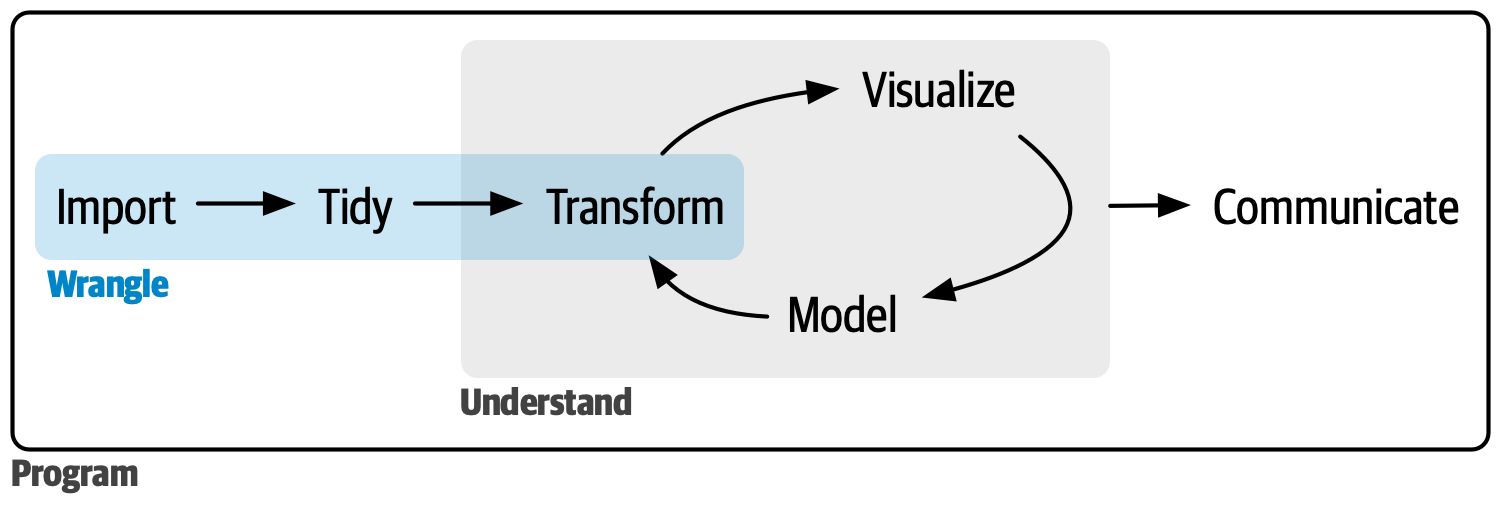
- Visualisation: A good visualisation shows you things that you did not expect or raise new questions about the data.
- Model: Models are complementary tools to visualisation. Once you have made your questions sufficiently precise, you can use a model to answer them.
- Communication: It doesn’t matter how well your models and visualization have led you to understand the data unless you can also communicate your results to others.
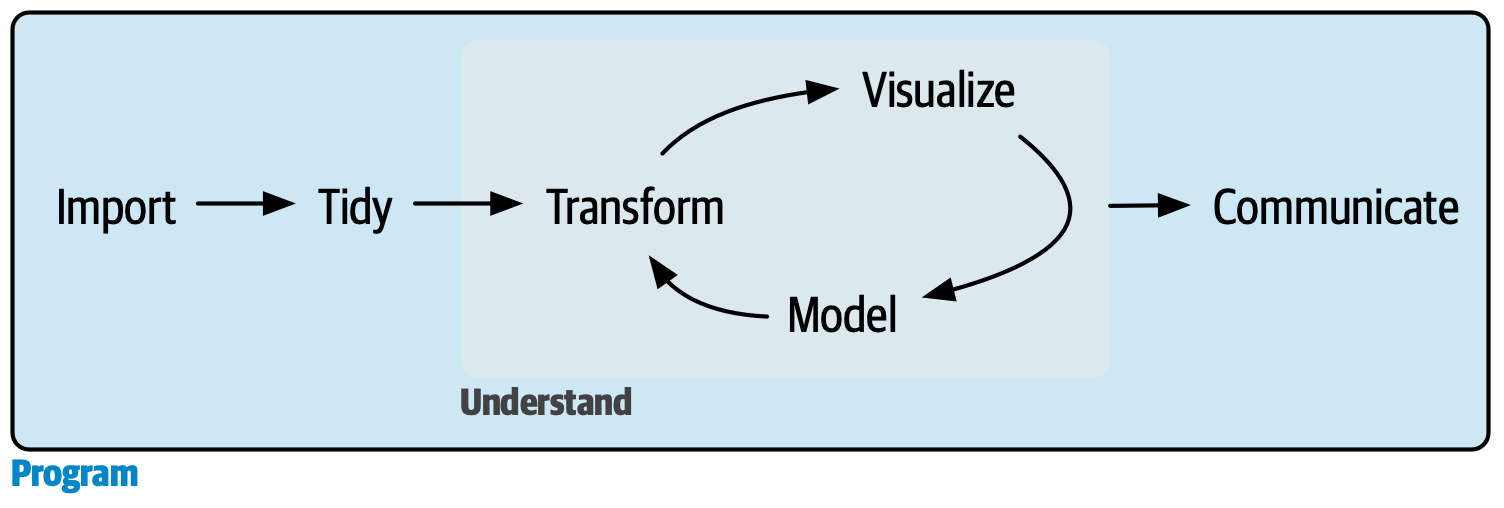
- Programming: Surrounding all these tools is programming.
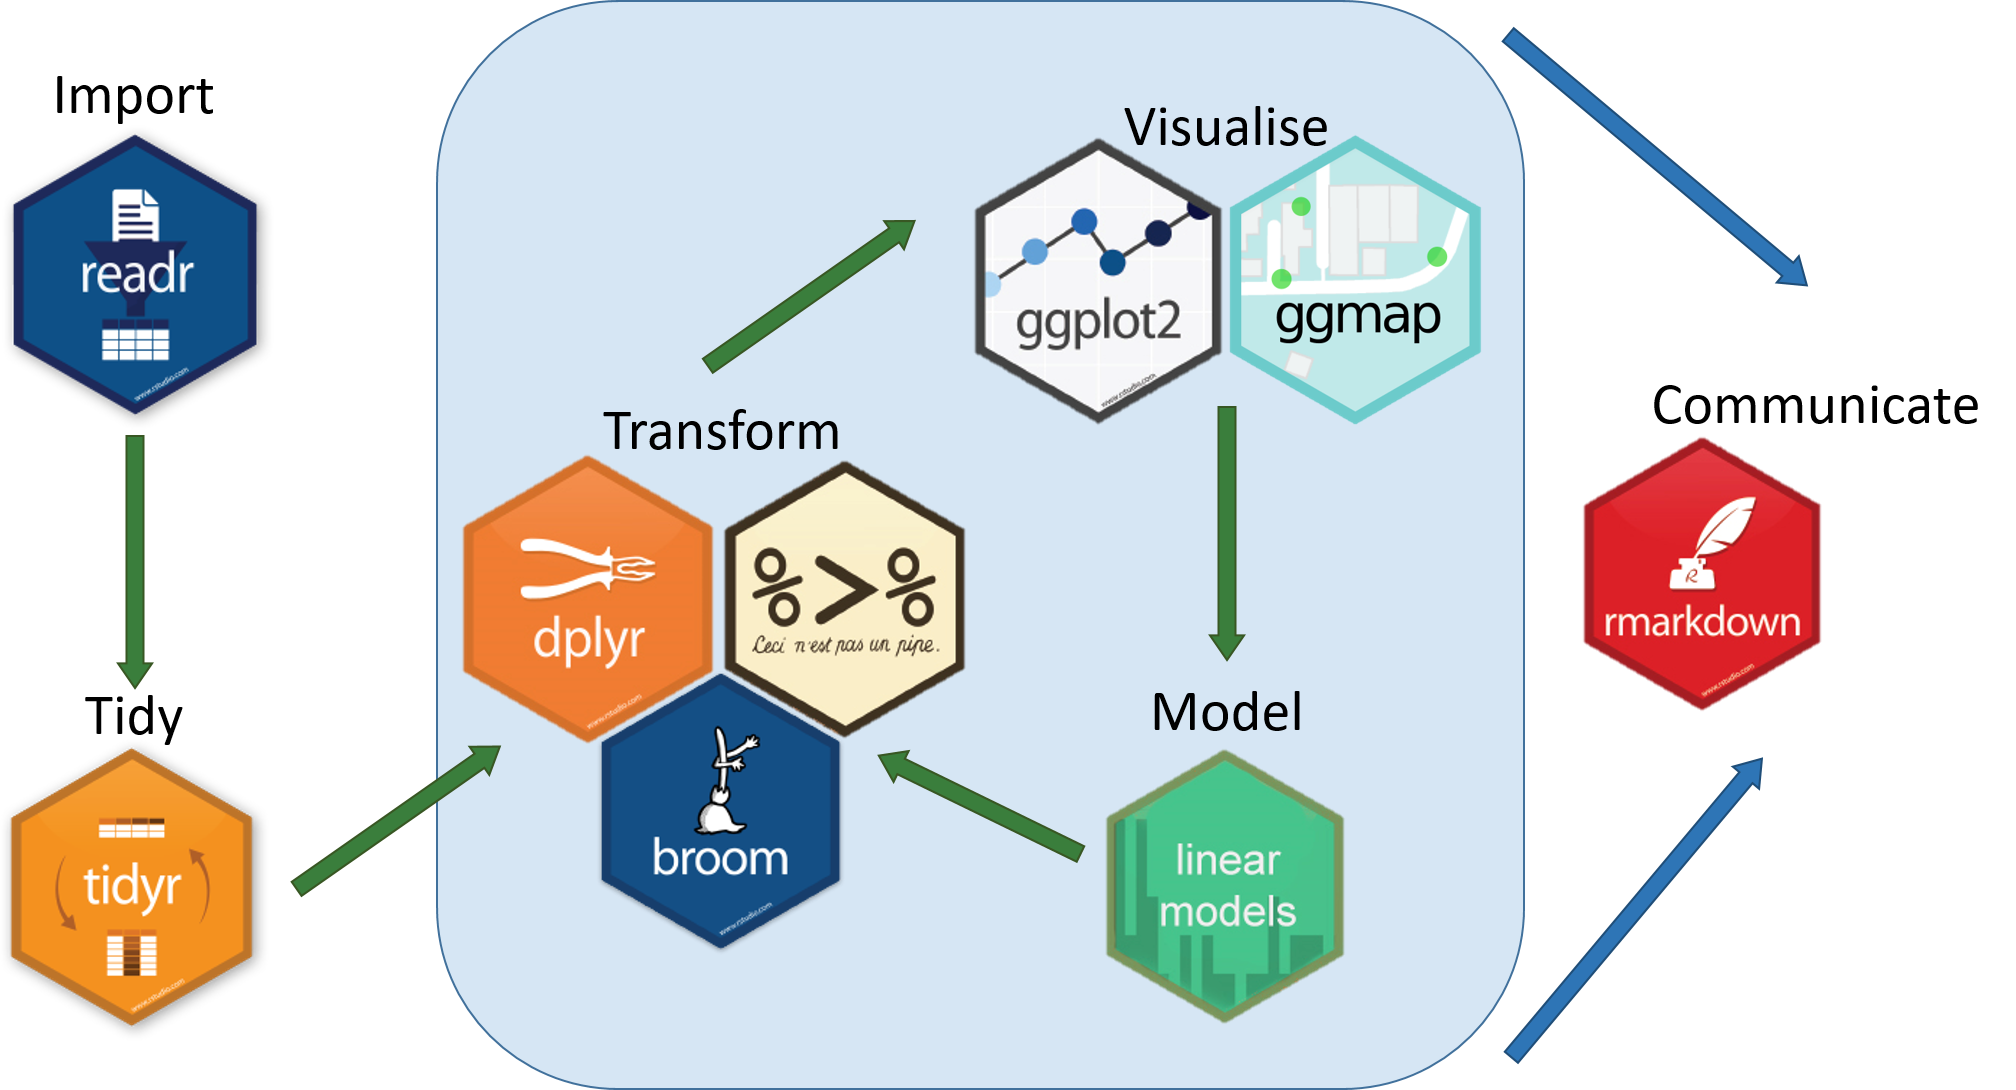
R for Data Science

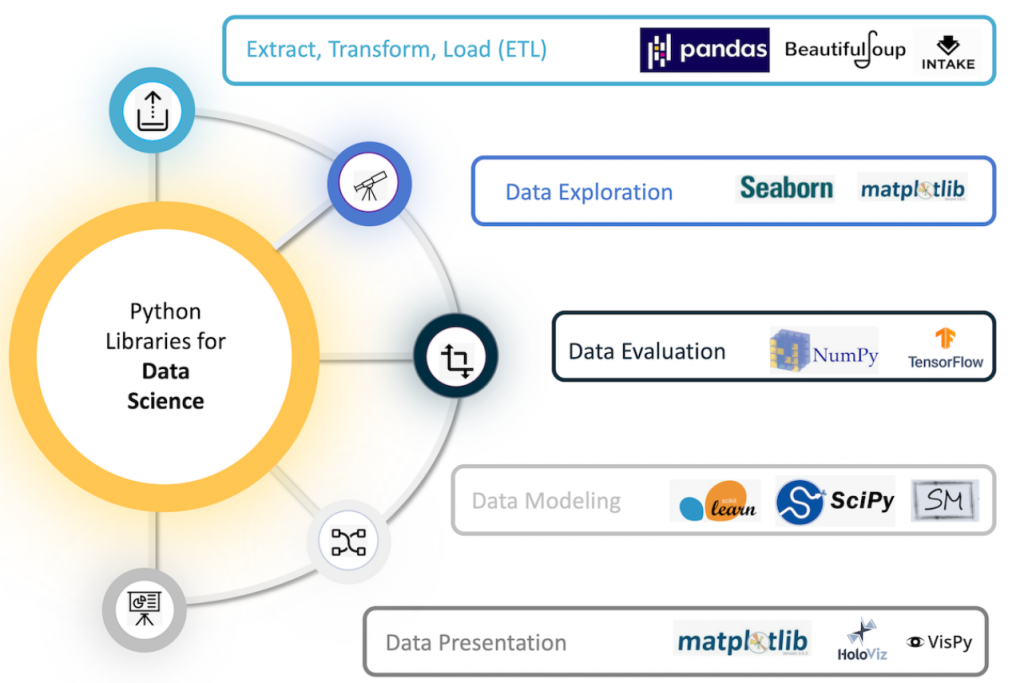
Python for Data Science
![]()