
Tidying Data 🧹
MATH/COSC 3570 Introduction to Data Science
Dr. Cheng-Han Yu
Department of Mathematical and Statistical Sciences
Marquette University
Department of Mathematical and Statistical Sciences
Marquette University
Grammar of Data Tidying
Grammar of Data Tidying
- Have data organised in an unideal way for our analysis
- Want to re-organise the data to carry on with our analysis
The goal of tidyr is to help you tidy your data via
- pivoting for going between wider and longer data
- separating and uniting character columns
- clarifying how
NAs should be treated - nesting and unnesting columns
Pivoting
- To tidy your data,
- first, figure out what the (column) variables and (row) observations are
- second is to resolve one of two common problems:
- One (column) variable might be spread across multiple columns.
- One (row) observation might be scattered across multiple rows.
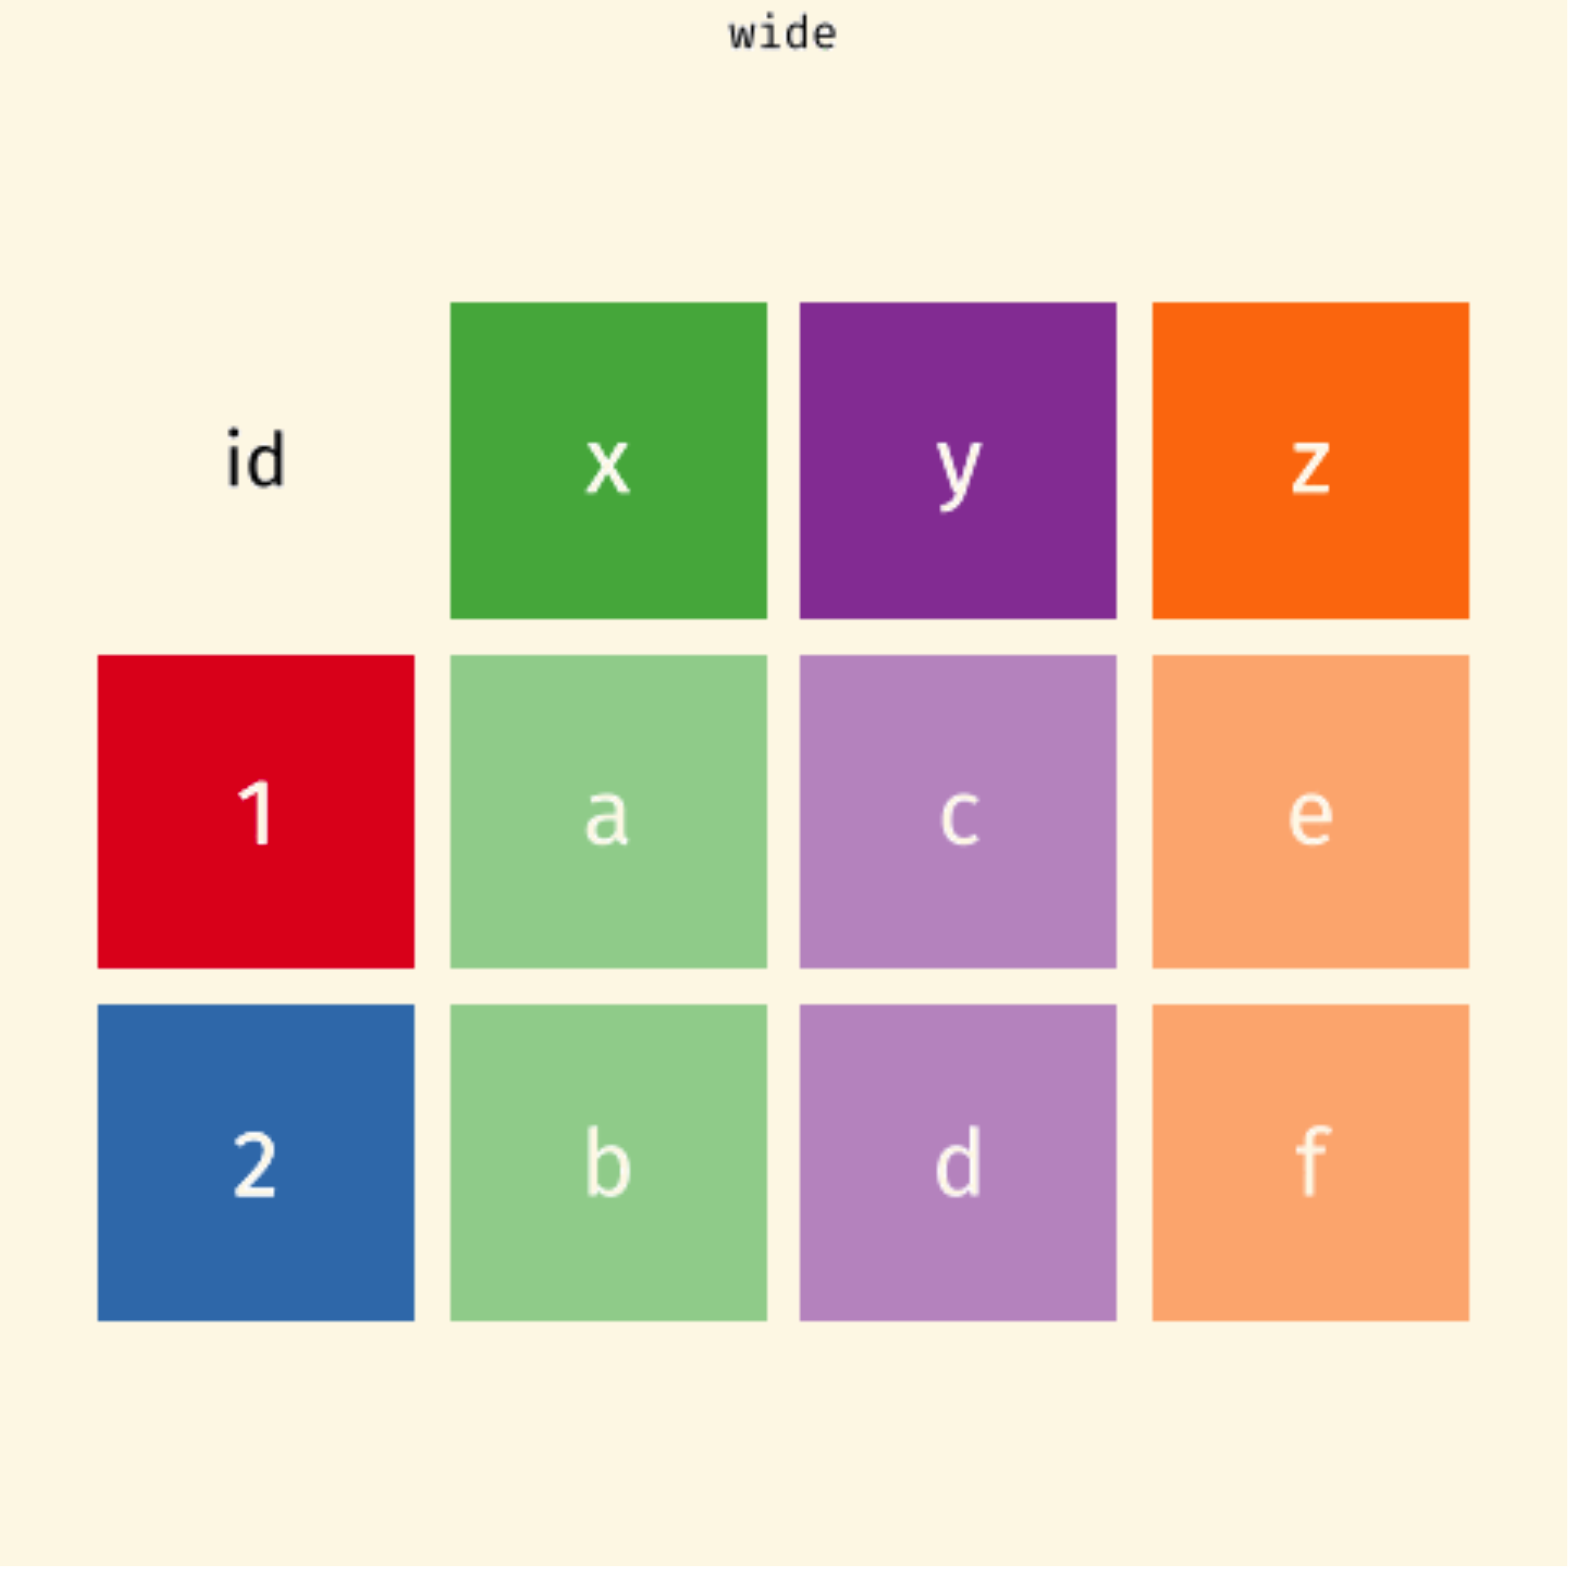
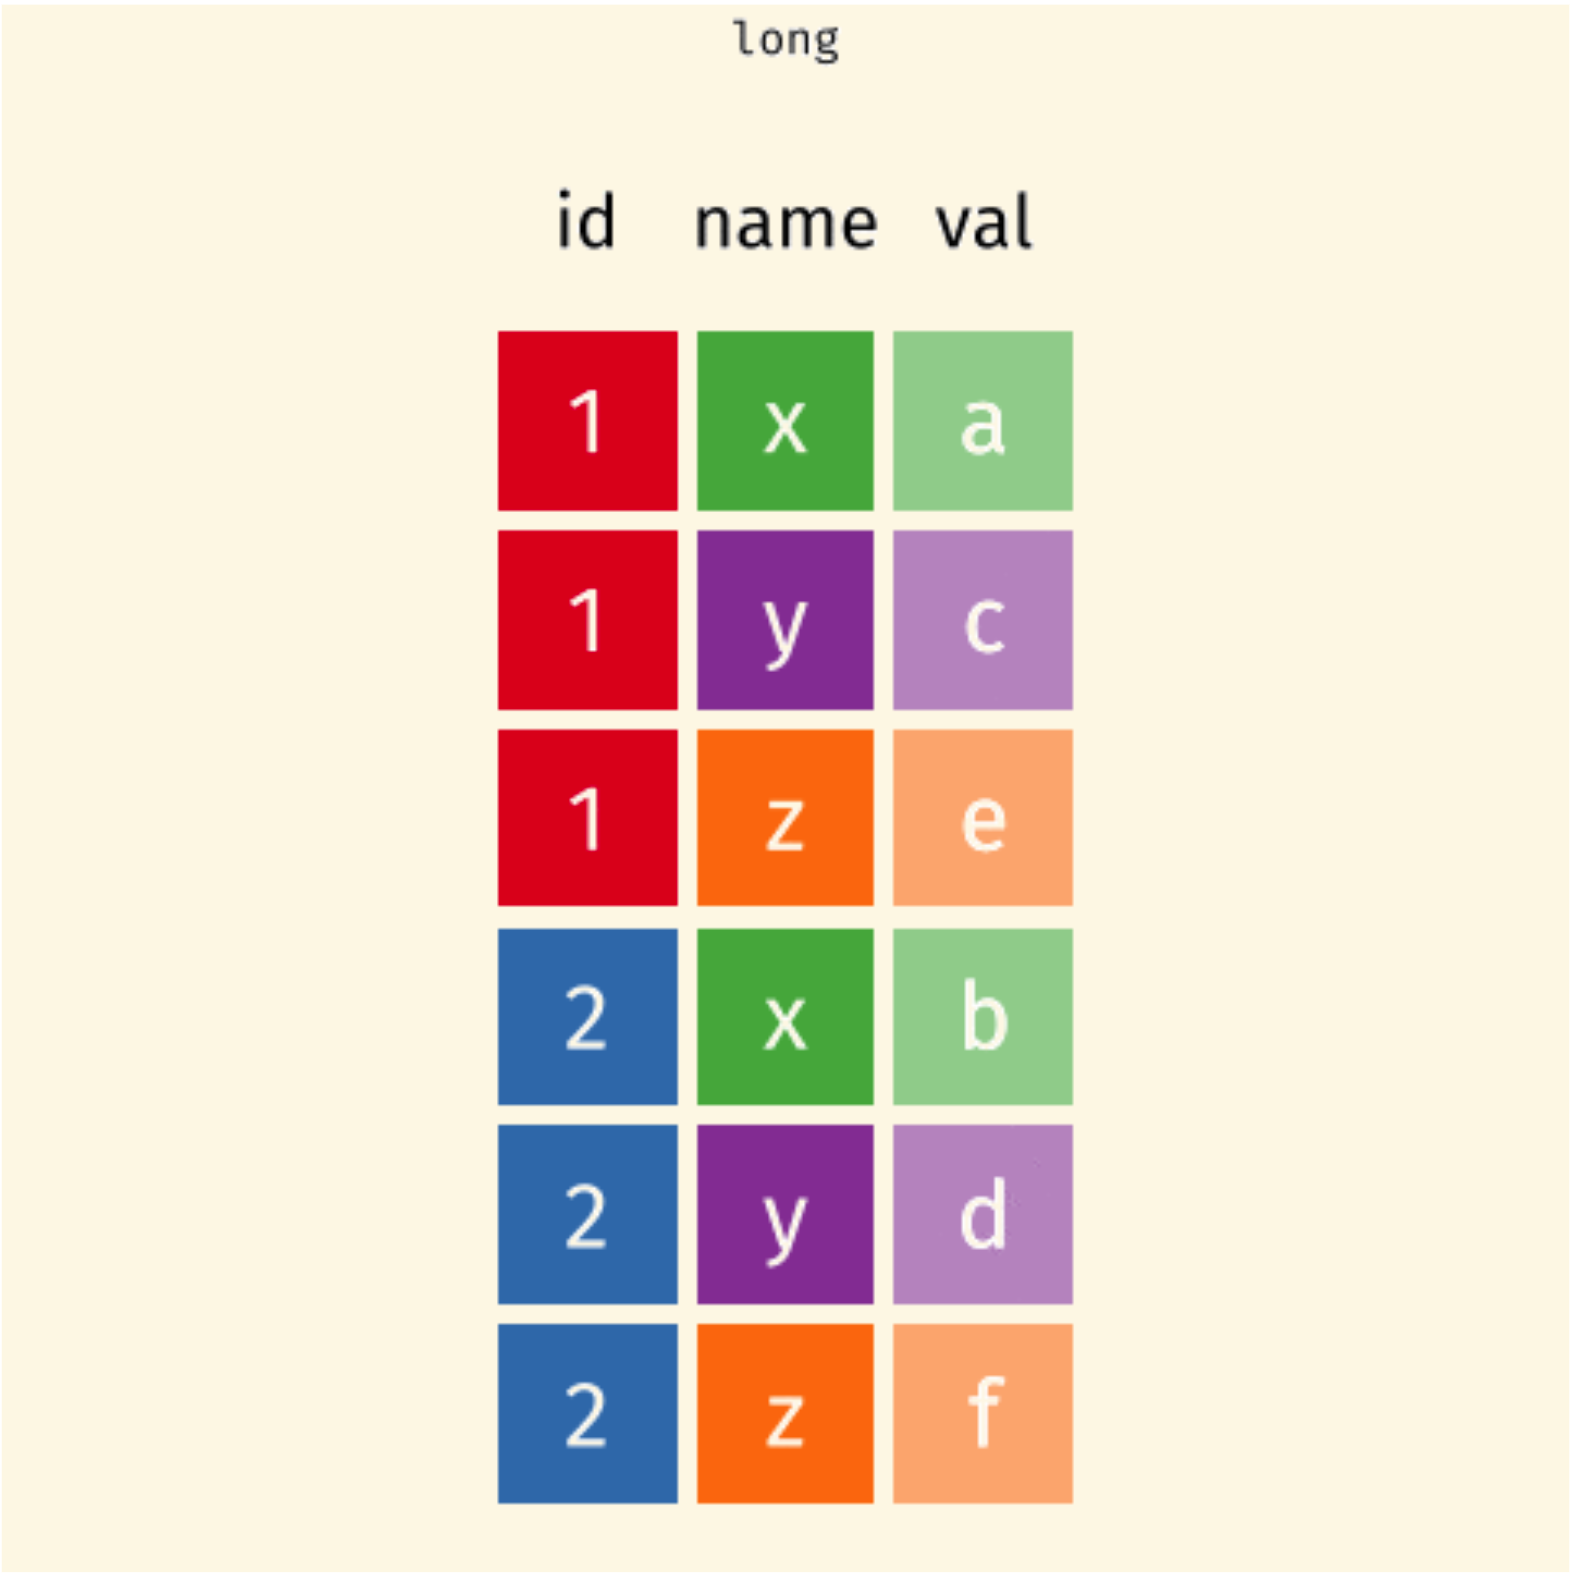
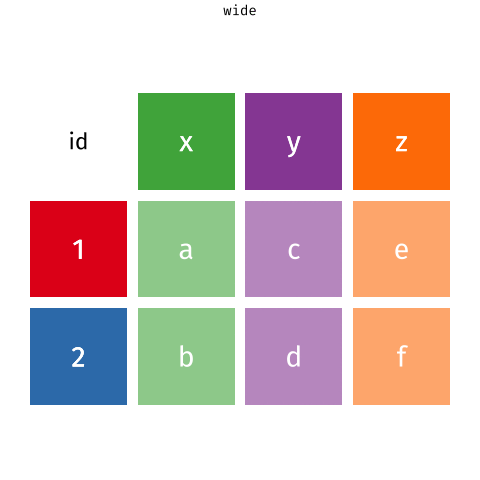
wider (\(2 \times 4\))
more columns
longer (\(6 \times 3\))
more rows by pivot_longer()
# A tibble: 6 × 3
customer_id item_no item
<dbl> <chr> <chr>
1 1 item_1 bread
2 1 item_2 milk
3 1 item_3 banana
4 2 item_1 milk
5 2 item_2 toilet paper
6 2 item_3 <NA>
pivot_longer() and pivot_wider()
To fix these problems, we’ll need
pivot_longer()andpivot_wider()-
Starts with a data set,
-
pivot_longer()add more rows and decreases the number of columns. -
pivot_wider()add more columns and decreases the number of rows.
-
pivot_longer() and pivot_wider()
One variable spreads across multiple columns
One subject is scattered across multiple rows
pivot_longer() and pivot_wider()
Data: sales/customers.csv
wider (\(2 \times 4\))
more columns
longer (\(6 \times 3\))
more rows by pivot_longer()
# A tibble: 6 × 3
customer_id item_no item
<dbl> <chr> <chr>
1 1 item_1 bread
2 1 item_2 milk
3 1 item_3 banana
4 2 item_1 milk
5 2 item_2 toilet paper
6 2 item_3 <NA> pivot_longer()
pivot_longer()
pivot_longer()
pivot_longer()
data: data framecols: columns to pivot into longer formatnames_to: name of the column where column names of pivoted variables go (character string)values_to: name of the column where data values in pivoted variables go (character string)
customers \(\rightarrow\) purchases
# A tibble: 2 × 4
  customer_id item_1 item_2       item_3
        <dbl> <chr>  <chr>        <chr>
1           1 bread  milk         banana
2 2 milk toilet paper <NA> # A tibble: 6 × 3
customer_id item_no item
<dbl> <chr> <chr>
1 1 item_1 bread
2 1 item_2 milk
3 1 item_3 banana
4 2 item_1 milk
5 2 item_2 toilet paper
6 2 item_3 <NA> In customers data,
Names item_1, item_2, item_3 are values of variable
item_noinpurchasesValues bread, milk, etc are values of variable
iteminpurchases
Why Pivot?
- The next step of your analysis needs it.
- The new
purchasesdata set and thepricesdata can now be joined together with the common key variableitem.
purchases \(\rightarrow\) customers
-
data: data frame -
names_from: which column variable in the long format contains the what should be column names in the wide format -
values_from: which column variable in the long format contains the what should be (cell) values in the new columns in the wide format
# A tibble: 6 × 3
  customer_id item_no item
        <dbl> <chr>   <chr>
1           1 item_1  bread
2           1 item_2  milk
3           1 item_3  banana
4           2 item_1  milk
5           2 item_2  toilet paper
6 2 item_3 <NA> # A tibble: 2 × 4
customer_id item_1 item_2 item_3
<dbl> <chr> <chr> <chr>
1 1 bread milk banana
2 2 milk toilet paper <NA> 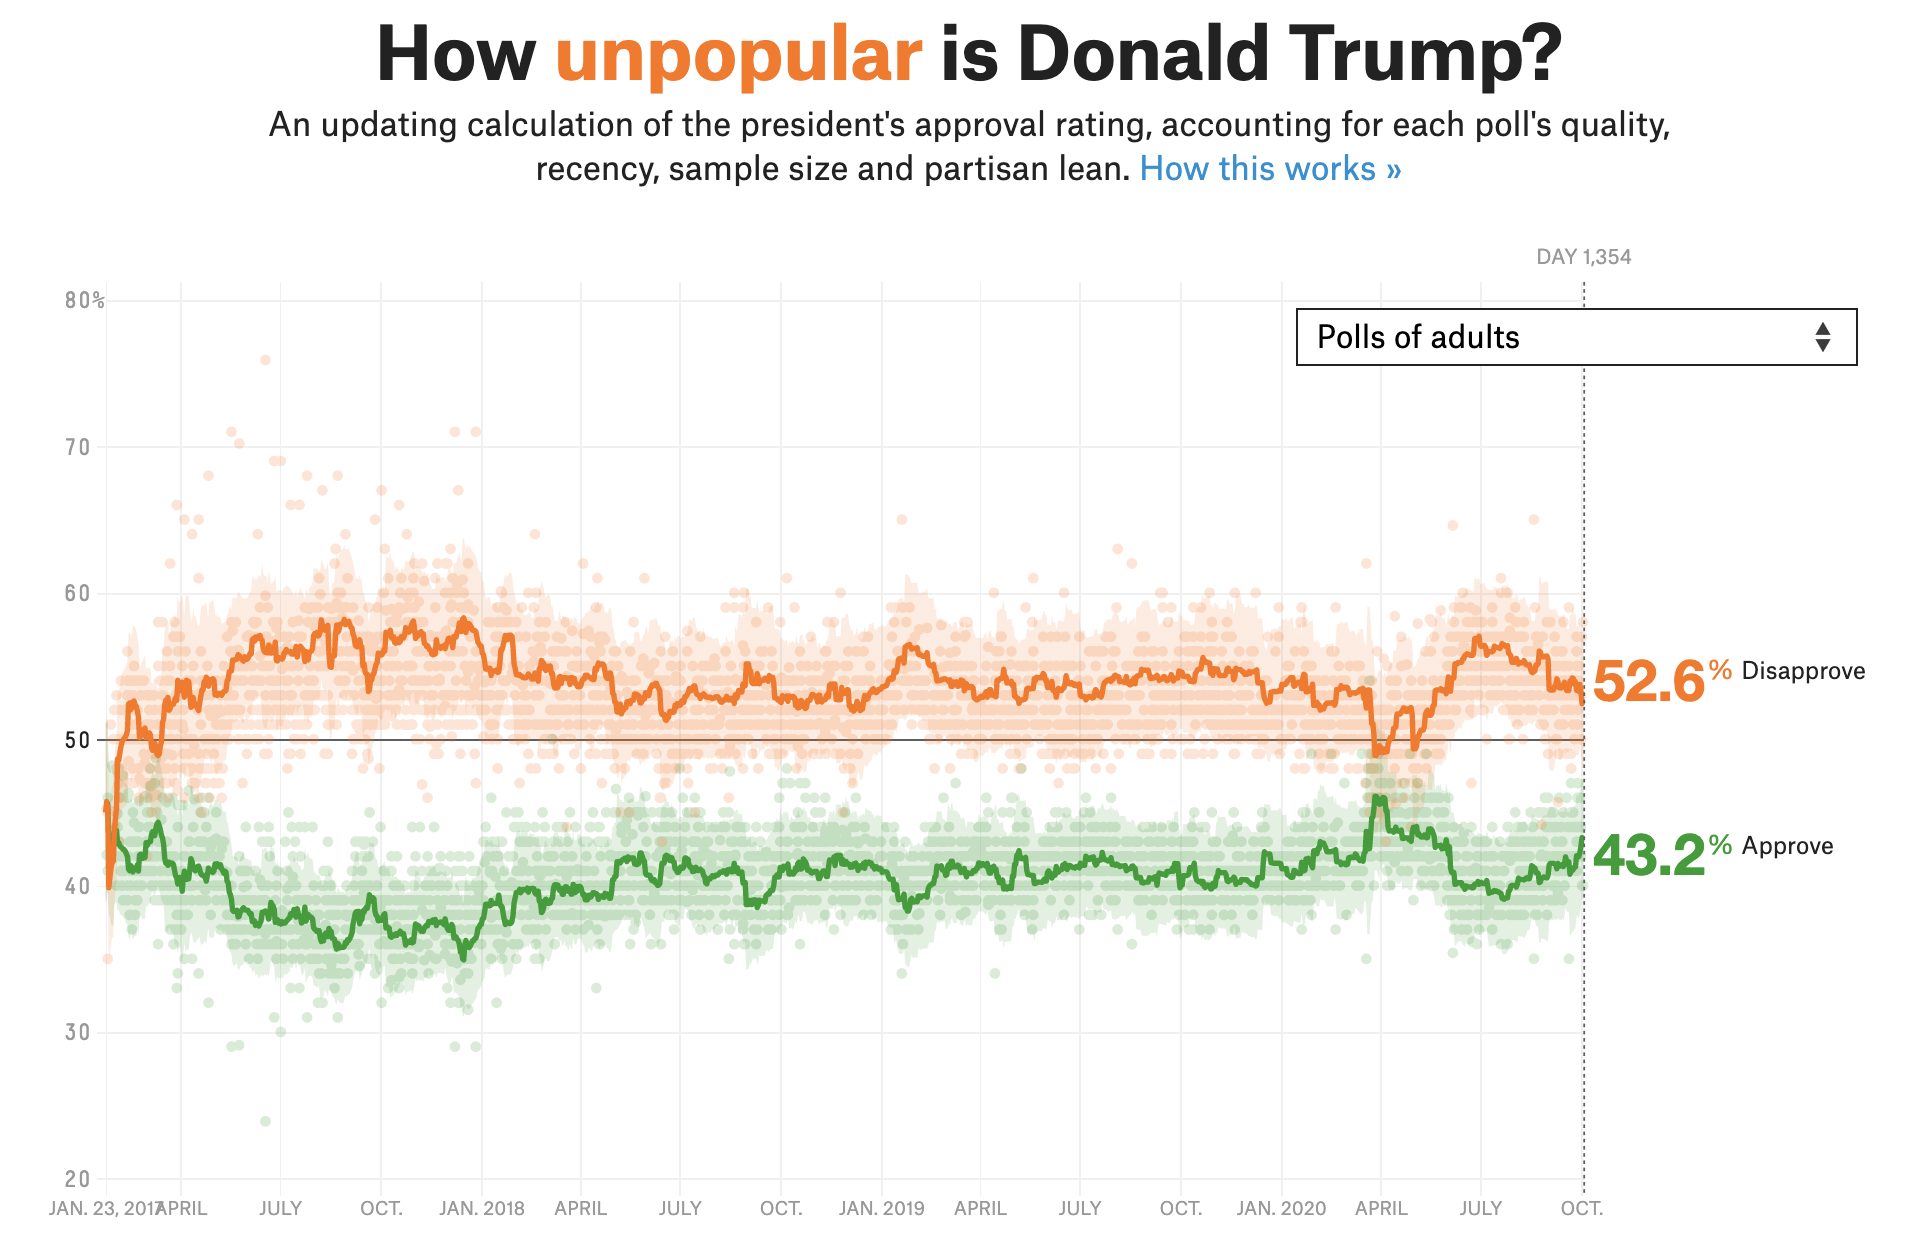
17-tidyr (Present your work!)
In lab.qmd ## Lab 17 section,
Import
trump.csv. Call ittrump_dataas below on the left.Use
pivot_longer()to transformtrump_datainto the data settrump_longeron the right.
# A tibble: 5,404 × 4
  subgroup date       rating_type rating_value
  <chr>    <date>     <chr>              <dbl>
1 Voters   2020-10-04 approval            44.7
2 Voters   2020-10-04 disapproval         52.2
3 Adults   2020-10-04 approval            43.2
4 Adults   2020-10-04 disapproval         52.6
5 Adults   2020-10-03 approval            43.2
6 Adults   2020-10-03 disapproval         52.6
# ℹ 5,398 more rows
BONUS 💳: Use trump_longer to generate a plot like the one below.
Pivoting
pd.wide_to_long()
pd.pivot()
pd.wide_to_long()
pd.pivot()
   customer_id  item_no          item
0            1        1         bread
1            2        1          milk
2            1        2          milk
3            2        2  toilet paper
4            1        3        banana
5 2 3 NaNitem_no 1 2 3
customer_id
1 bread milk banana
2 milk toilet paper NaN