K-Means Clustering
MATH/COSC 3570 Introduction to Data Science
Department of Mathematical and Statistical Sciences
Marquette University
Clustering Methods
Clustering: unsupervised learning technique for finding subgroups or clusters in a data set.
GOAL: Homogeneous within groups; heterogeneous between groups
-
Customer/Marketing Segmentation
- Divide customers into clusters on age, income, etc.
- Each subgroup might be more receptive to a particular form of advertising, or more likely to purchase a particular product.
K-Means Clustering
Partition observations into \(K\) distinct, non-overlapping clusters: assign each to exactly one of the \(K\) clusters.
Must pre-specify the number of clusters \(K \ll n\).

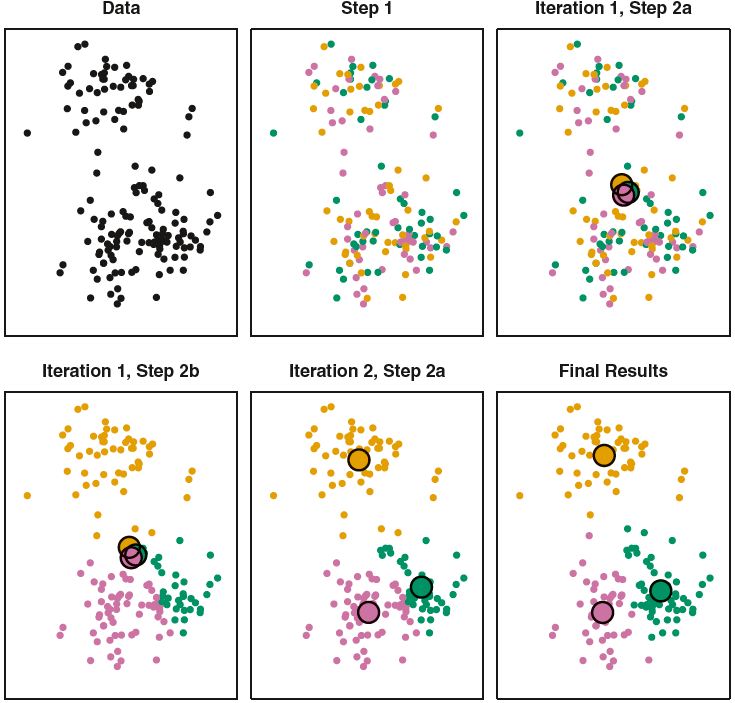
K-Means Illustration
Data (Let’s choose \(K=2\))

K-Means Algorithm
- Choose a value of \(K\).
- Randomly assign a number, from 1 to \(K\), to each of the observations.
- Iterate until the cluster assignments stop changing:
- [1] For each of the \(K\) clusters, compute its cluster centroid.
- [2] Assign each observation to the cluster whose centroid is closest.
K-Means Illustration
Random assignment

K-Means Algorithm
- Choose a value of \(K\).
- Randomly assign a number, from 1 to \(K\), to each of the observations.
- Iterate until the cluster assignments stop changing:
- [1] For each of the \(K\) clusters, compute its cluster centroid.
- [2] Assign each observation to the cluster whose centroid is closest.
K-Means Illustration
Compute the cluster centroid

K-Means Algorithm
- Choose a value of \(K\).
- Randomly assign a number, from 1 to \(K\), to each of the observations.
- Iterate until the cluster assignments stop changing:
- [1] For each of the \(K\) clusters, compute its cluster centroid.
- [2] Assign each observation to the cluster whose centroid is closest.
K-Means Illustration
Do new assignment

Compute the cluster centroid …


K-Means Algorithm
Note
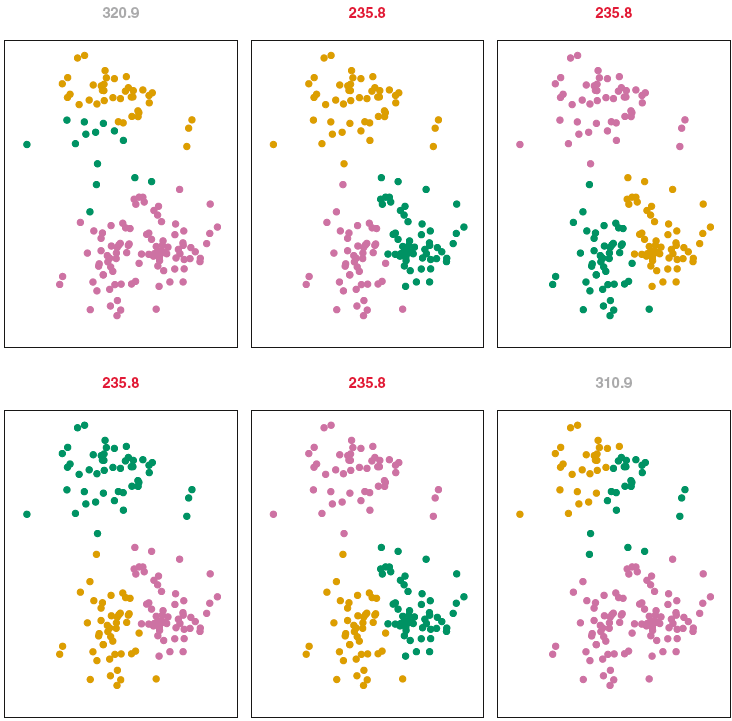
- The K-means algorithm finds a local rather than global optimum.
- The results depend on the initial cluster assignment of each observation.
- Run the algorithm multiple times, then select the one producing the smallest within-cluster variation.
- Standardize the data so that distance is not affected by variable unit.

Data for K-Means
Data for K-Means

kmeans()
K-means clustering with 3 clusters of sizes 67, 88, 85

Cluster means:
    age income
1 -0.29   1.33
2  1.04  -0.32
3 -0.85  -0.71

Clustering vector:
  [1] 1 2 2 3 2 3 2 3 1 2 2 3 3 2 3 3 1 3 1 1 3 3 3 2 3 3 2 2 3 1 3 2 1 1 2 1 3
 [38] 3 3 1 3 3 2 1 3 1 2 3 2 2 2 3 1 3 2 3 3 2 1 2 2 3 2 2 2 3 3 2 3 2 2 3 1 1
 [75] 3 2 3 2 2 3 2 2 3 2 1 1 1 2 2 2 3 3 3 3 1 2 1 3 3 2 3 3 2 3 1 2 2 3 1 1 1
[112] 2 1 2 2 2 2 3 2 2 2 1 3 1 3 2 2 2 1 1 2 1 3 2 3 1 1 1 1 3 2 1 1 3 3 3 2 2
[149] 3 2 1 2 1 3 1 3 2 3 1 2 2 1 3 3 3 2 2 1 3 3 2 3 1 1 2 3 2 3 1 3 1 3 1 2 3
[186] 2 2 1 2 2 2 1 3 2 2 2 2 1 1 1 2 1 1 3 1 3 3 1 2 1 3 3 2 2 1 3 3 3 2 1 2 1
[223] 2 3 3 3 2 1 3 1 1 1 3 2 2 2 1 3 3 1

Within cluster sum of squares by cluster:
[1] 66 41 39
 (between_SS / total_SS =  69.5 %)

Available components:

[1] "cluster"      "centers"      "totss"        "withinss"     "tot.withinss"
[6] "betweenss"    "size"         "iter"         "ifault"
kmeans()
Cluster Info
# A tibble: 240 × 3
     age income .cluster
   <dbl>  <dbl> <fct>
1 -0.878  1.00  1
2  1.44  -0.601 2
3  1.00  -0.668 2
4 -1.38  -1.63  3
5  1.64  -0.831 2
6 -0.137 -0.851 3
# ℹ 234 more rowsK-Means in R

- Steady-income family
- New college graduates/mid-class young family
- High socioeconomic class
K-Means in R: factoextra

Choose K: Total Withing Sum of Squares

Practical Issues
- Try several different \(K\)s, and look for the one with the most useful or interpretable solution.
Clustering is not beneficial for decision making or strategic plan if the clusters found are not meaningful based on their features.
The clusters found may be heavily distorted due to outliers that do not belong to any cluster.
Clustering methods are not very robust to perturbations of the data.
23-K means Clustering
In lab.qmd ## Lab 24 section,
Install R package
palmerpenguinsat https://allisonhorst.github.io/palmerpenguins/Perform K-Means to with \(K = 3\) to cluster penguins based on
bill_length_mmandflipper_length_mmof datapeng.

