
Course Summary and Next
MATH/COSC 3570 Introduction to Data Science
Summary of 3570
You’ve learned a lot in this course!
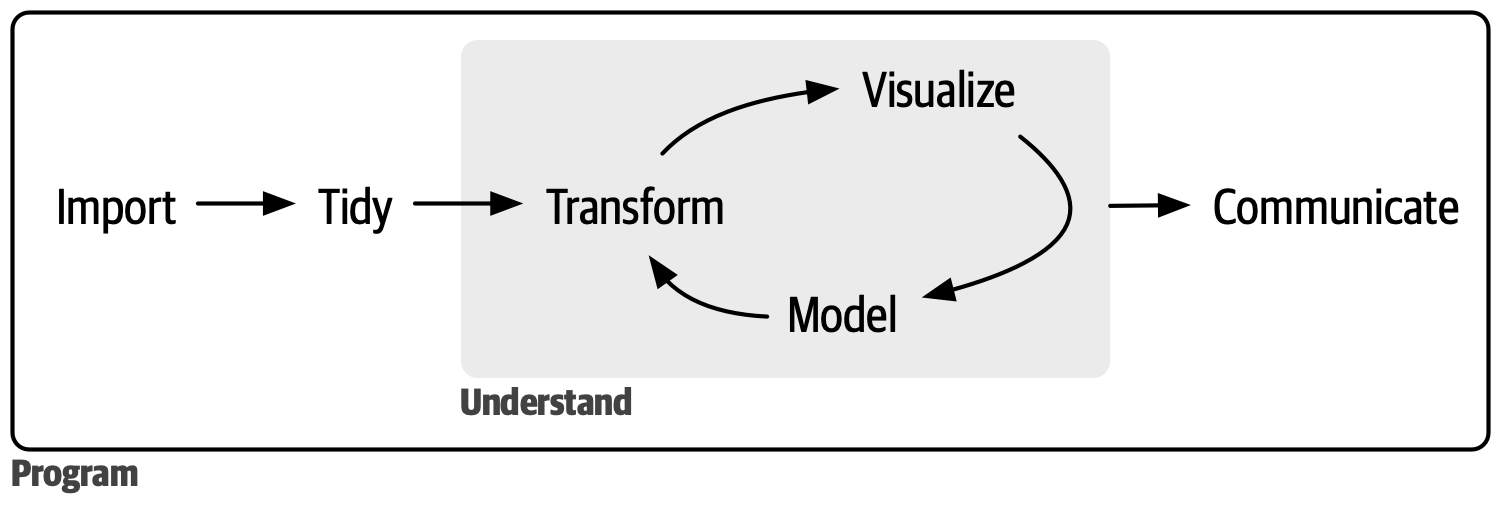
Data importing > wrangling > visualization > statistical machine learning > reporting
Recommendation
If you want to learn advanced machine learning,


- Probability (MATH 4700)
- Statistical inference (MATH 4710)
- Linear algebra (MATH 3100)
- Optimization (MATH 4650)
- Data structure (COSC 2100)
- Algorithms (COSC 3100)
Recommendation
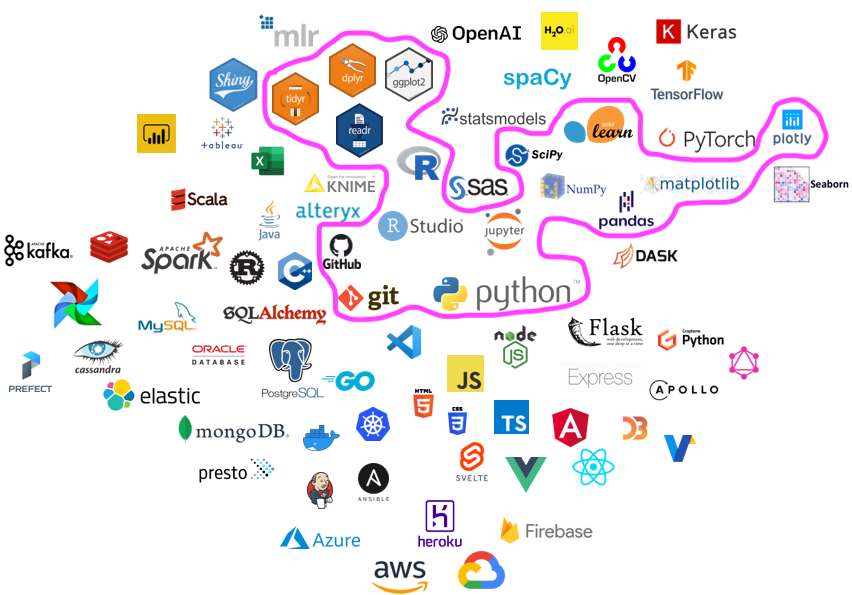
If you want to be a professional data scientist,
![]()
![]()
![]()
![]()
ADP in Applied Statistics
- BA/BS and MS in 5 years
- Advanced statistical and data analytics tools
- No application fees
- Courses include
- Computational Probability
- Statistical Simulation
- Applied Linear Algebra
- Design of Experiments
- Machine Learning
- Statistical Computing and more!

Evaluation Sheet

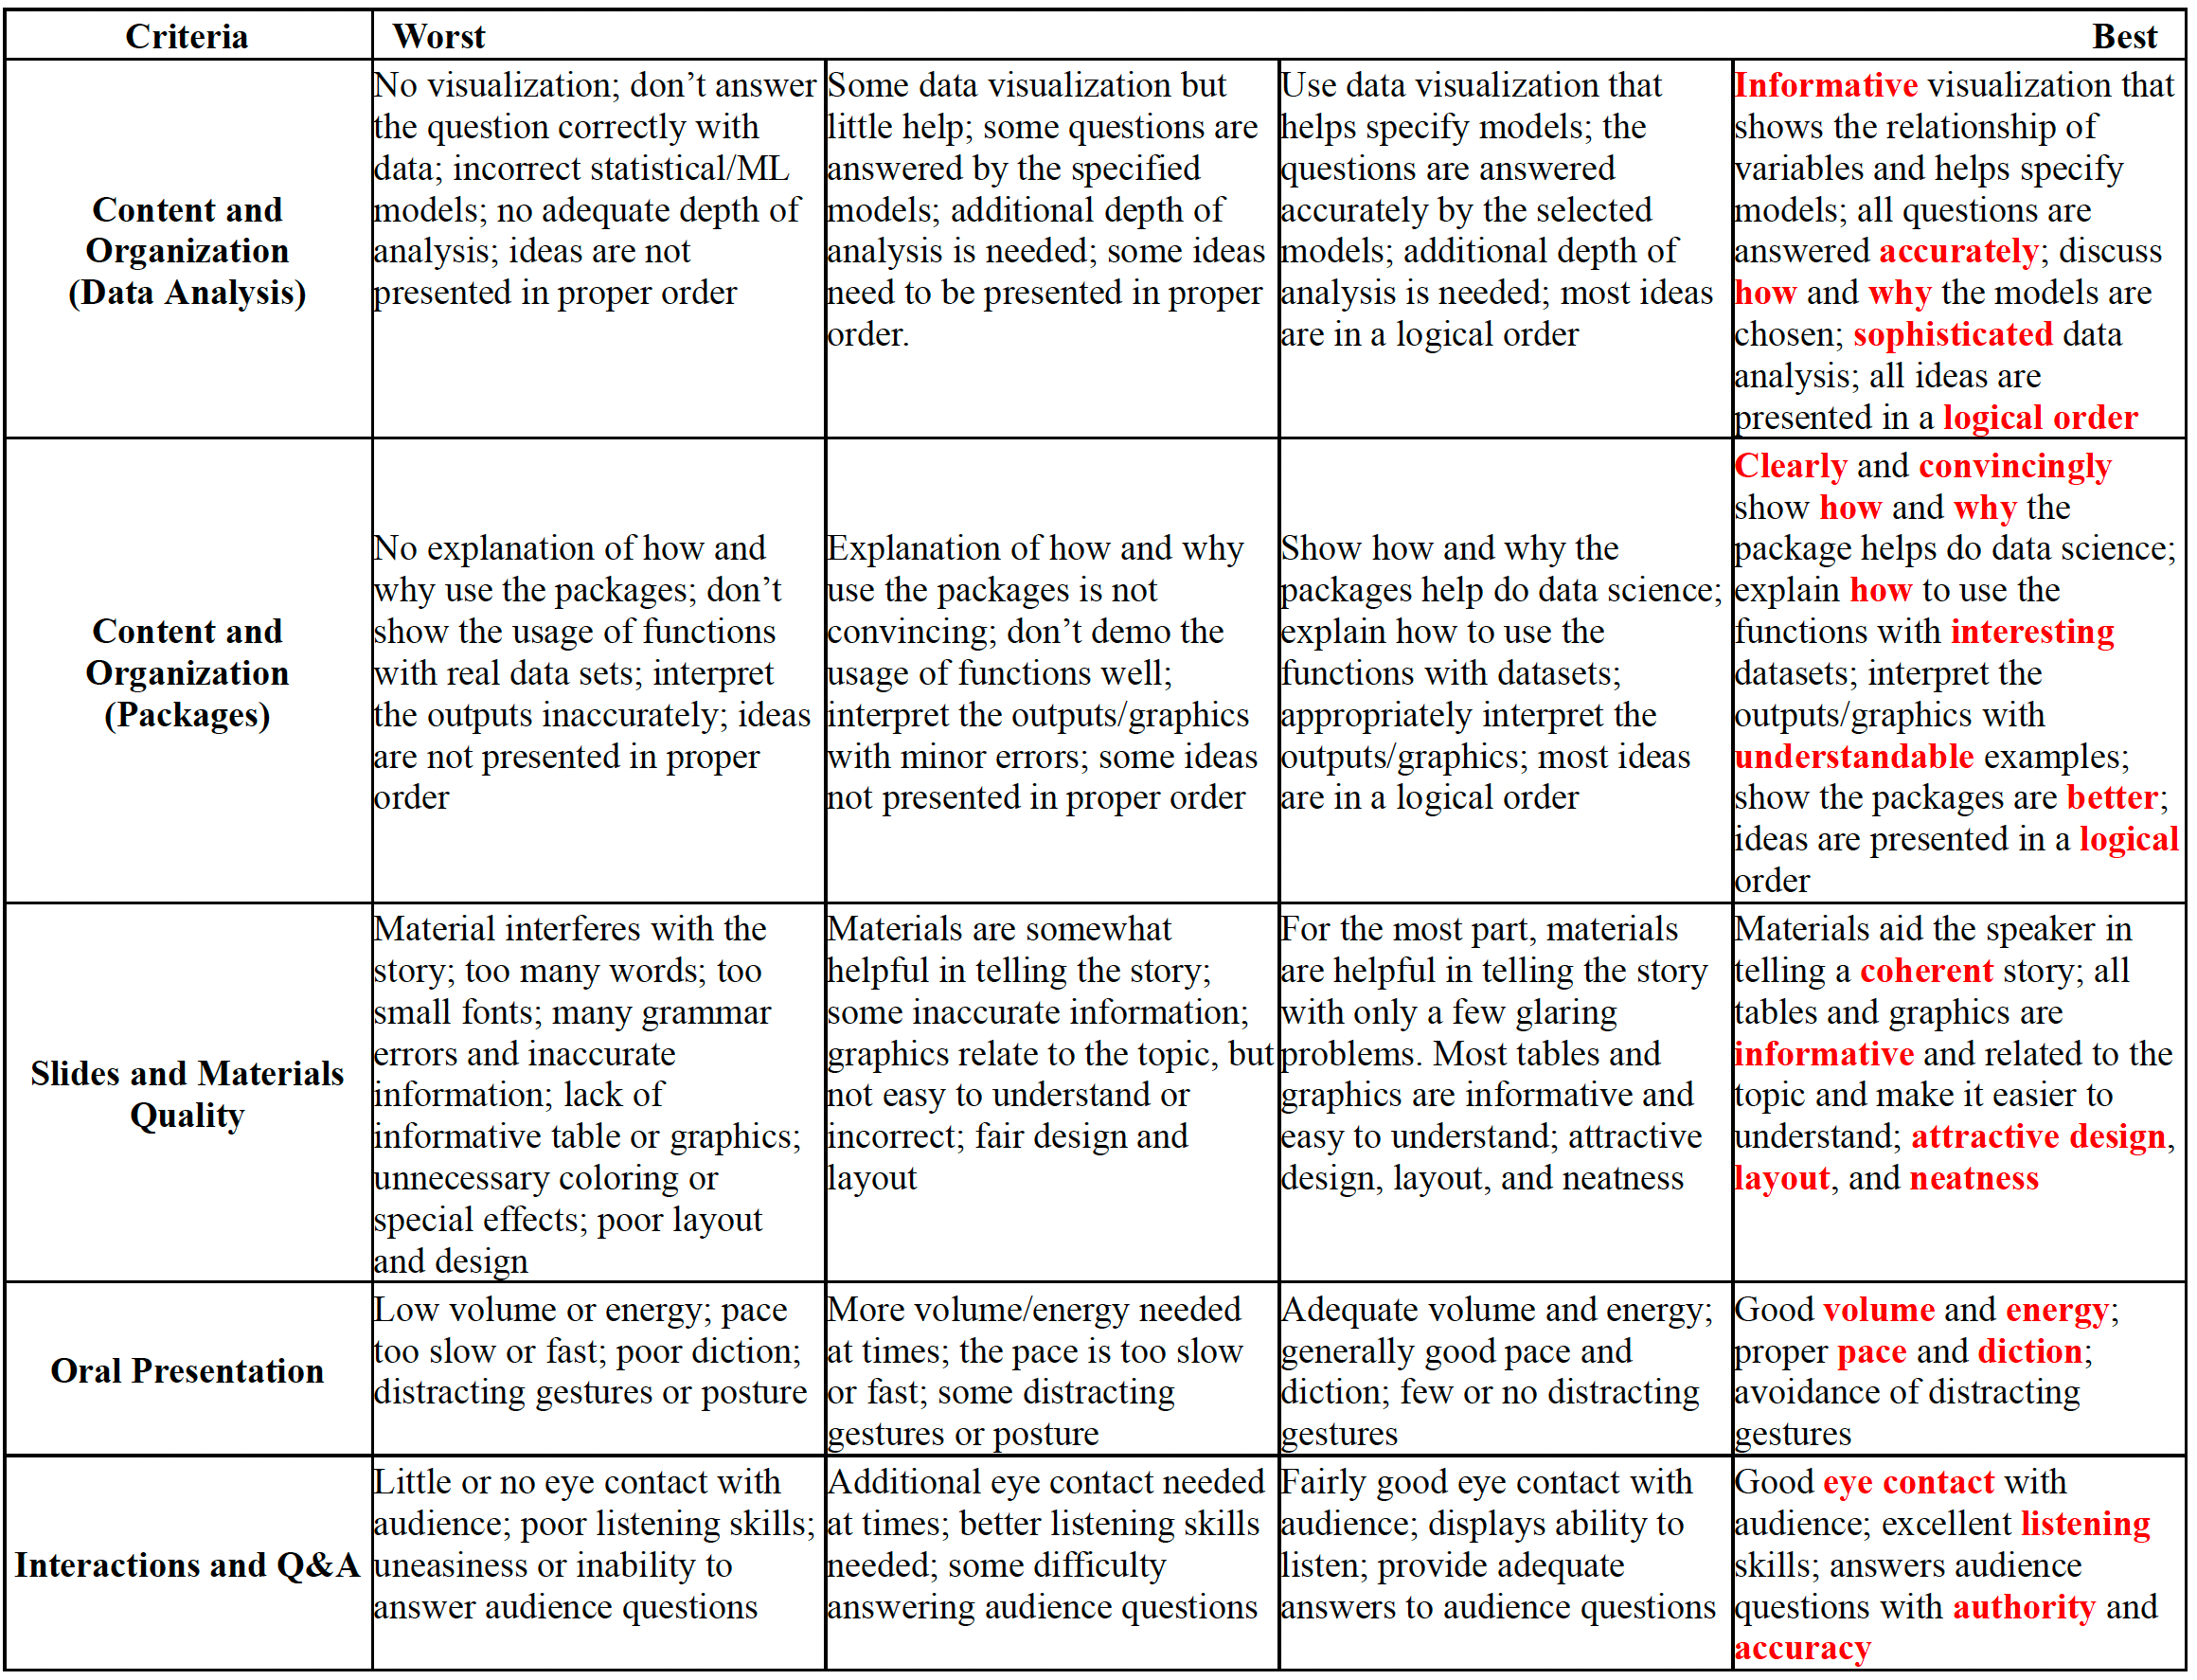
Evaluation Rubric

Thank you!
![]()