Lab 11: ggplot2
Note
In lab.qmd ## Lab 11 section,
Use
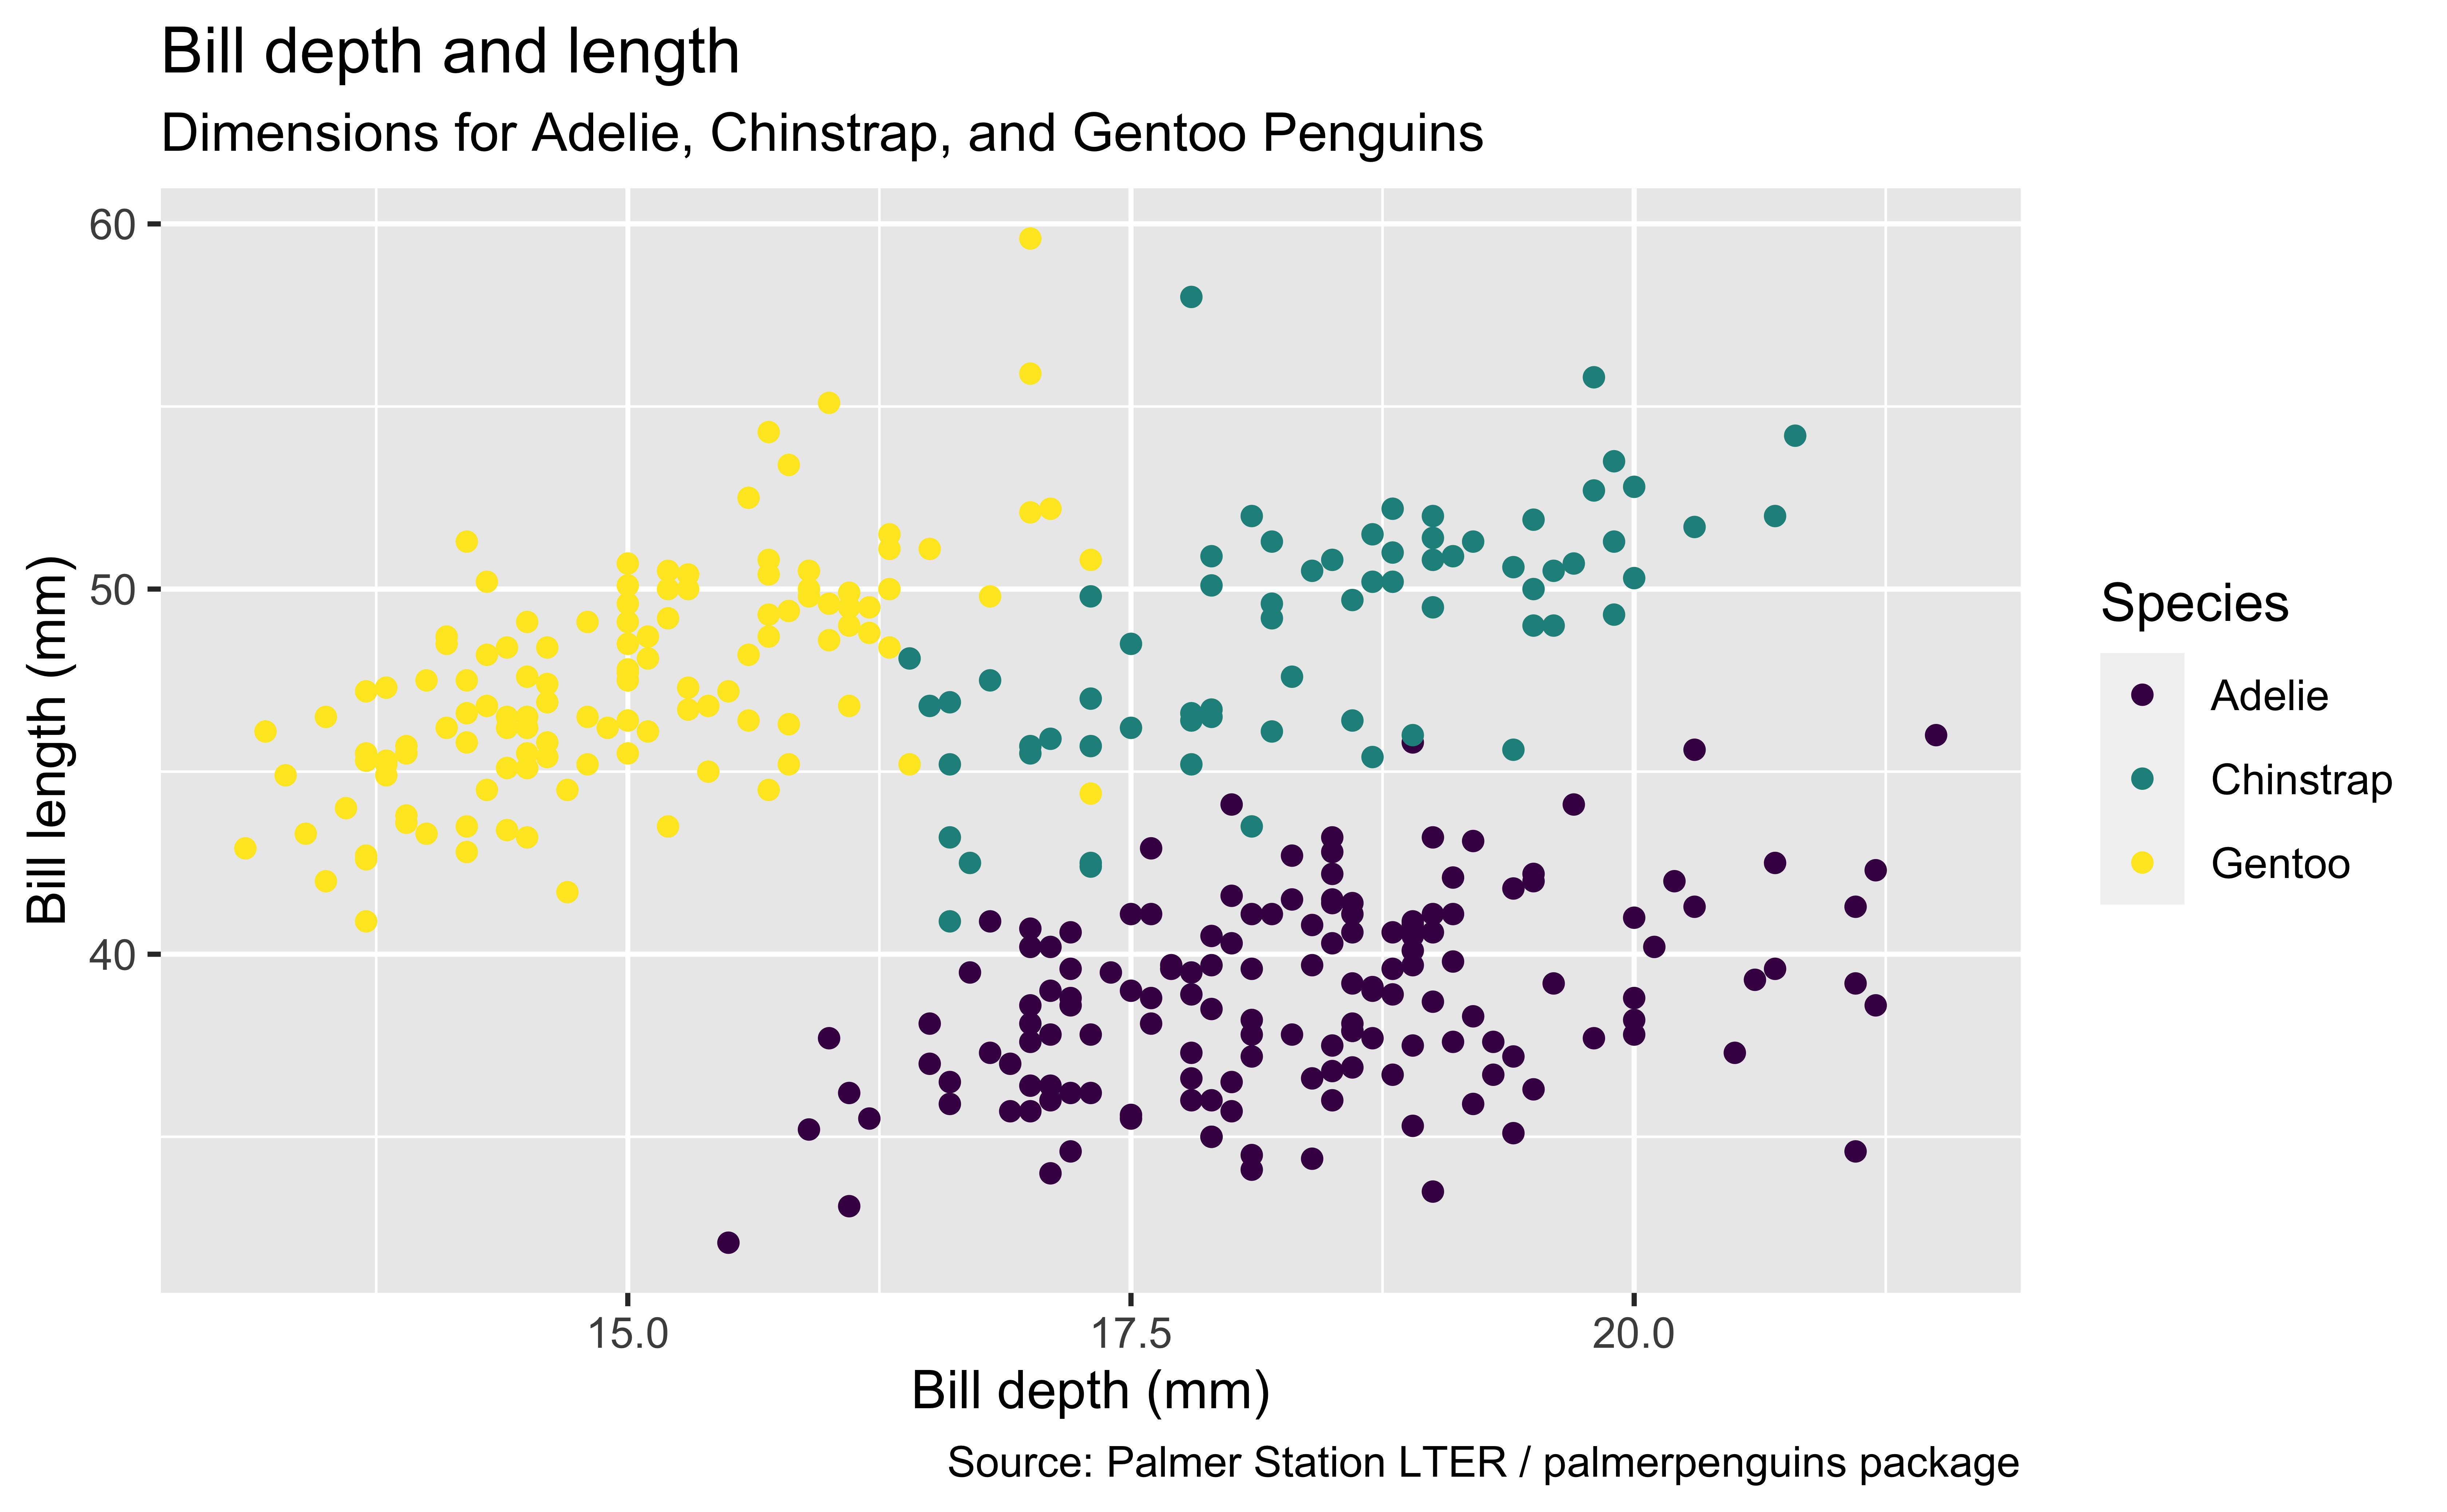
readr::read_csv()to import the data penguins.csv into your R workspace.Generate the following ggplot:
penguins <- read_csv(_________________)
________ |>
  ggplot(mapping = ____(x = ______________,
                        y = ______________,
                        colour = ________)) +
  geom______() +
  ____(title = ____________________,
       _________ = "Dimensions for Adelie, Chinstrap, and Gentoo Penguins",
       x = _____________, y = _______________,
       _______ = "Species",
       _______ = "Source: Palmer Station LTER / palmerpenguins package")