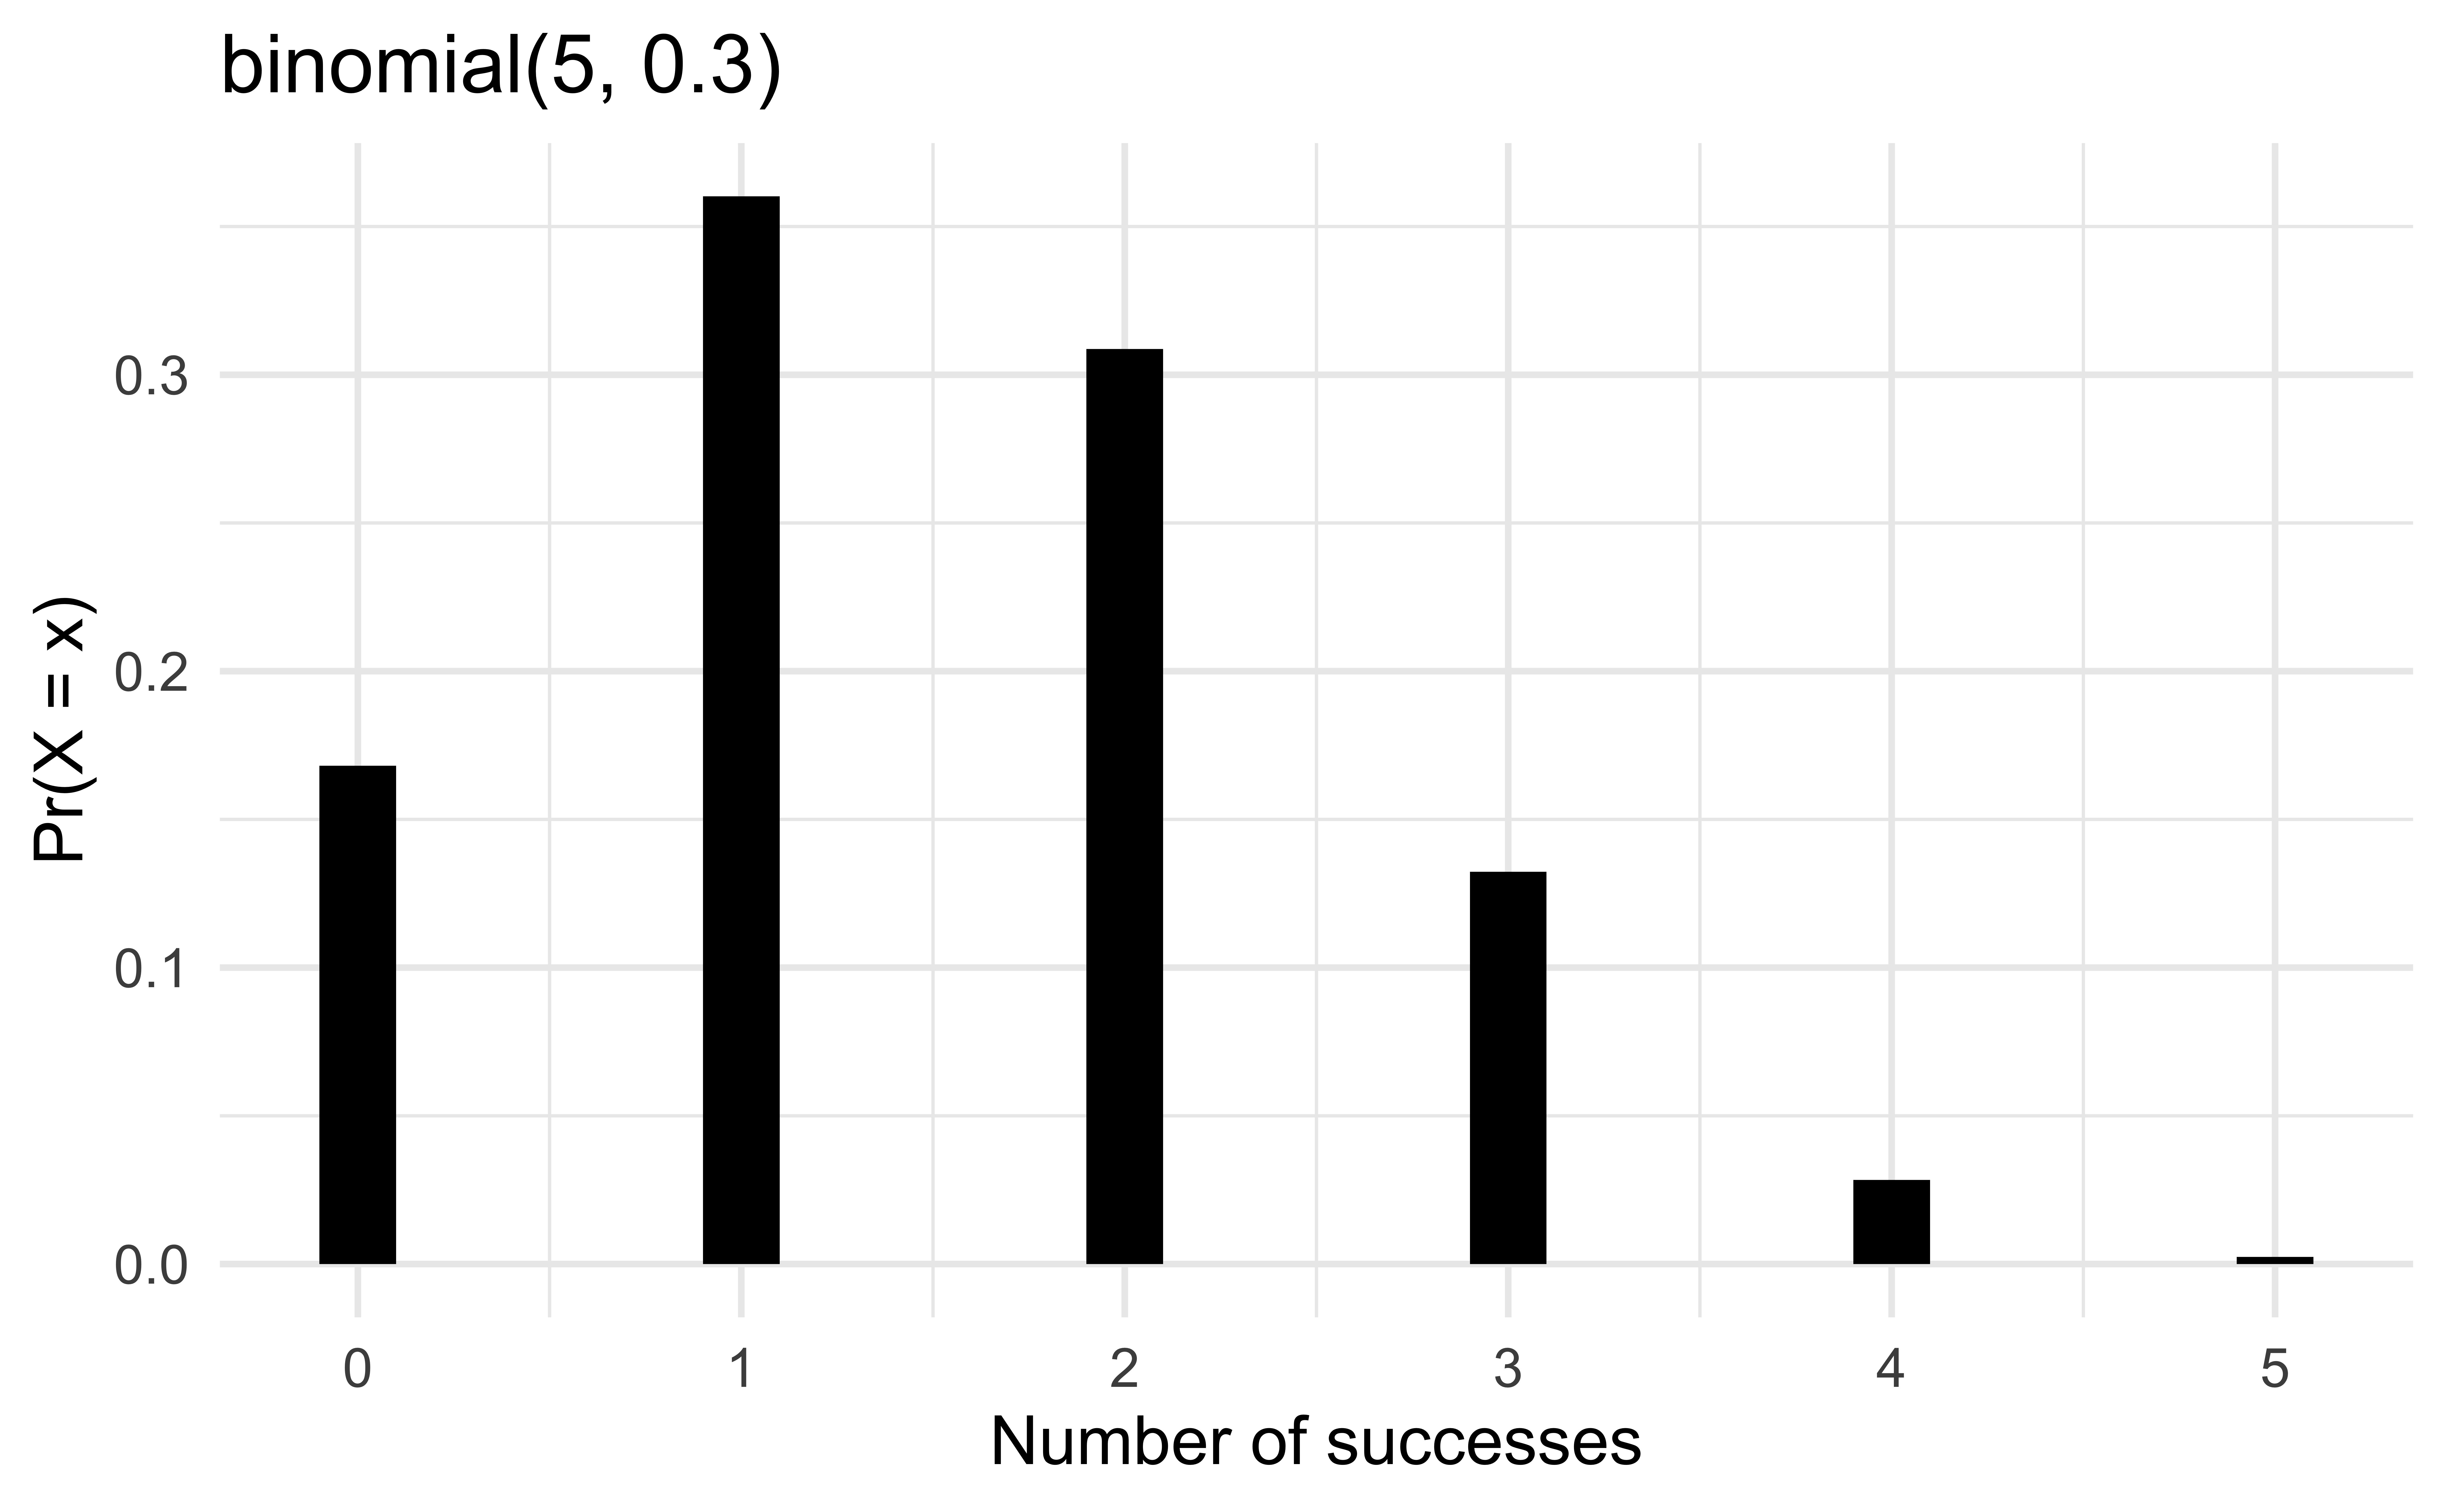
# A tibble: 6 × 2
      x       y
  <int>   <dbl>
1     0 0.168
2     1 0.360
3     2 0.309
4     3 0.132
5     4 0.0284
6 5 0.00243Lab 18: Probability
Note
In lab.qmd ## Lab 18 section,
- Plot the probability function \(P(X = x)\) of \(X \sim \text{binomial}(n = 5, \pi = 0.3)\).
To use ggplot,
- Create a data frame saving all possible values of \(x\) and their corresponding probability using
dbinom(x, size = ___, prob = ___).
- Add
geom_col()

:::
